






 By
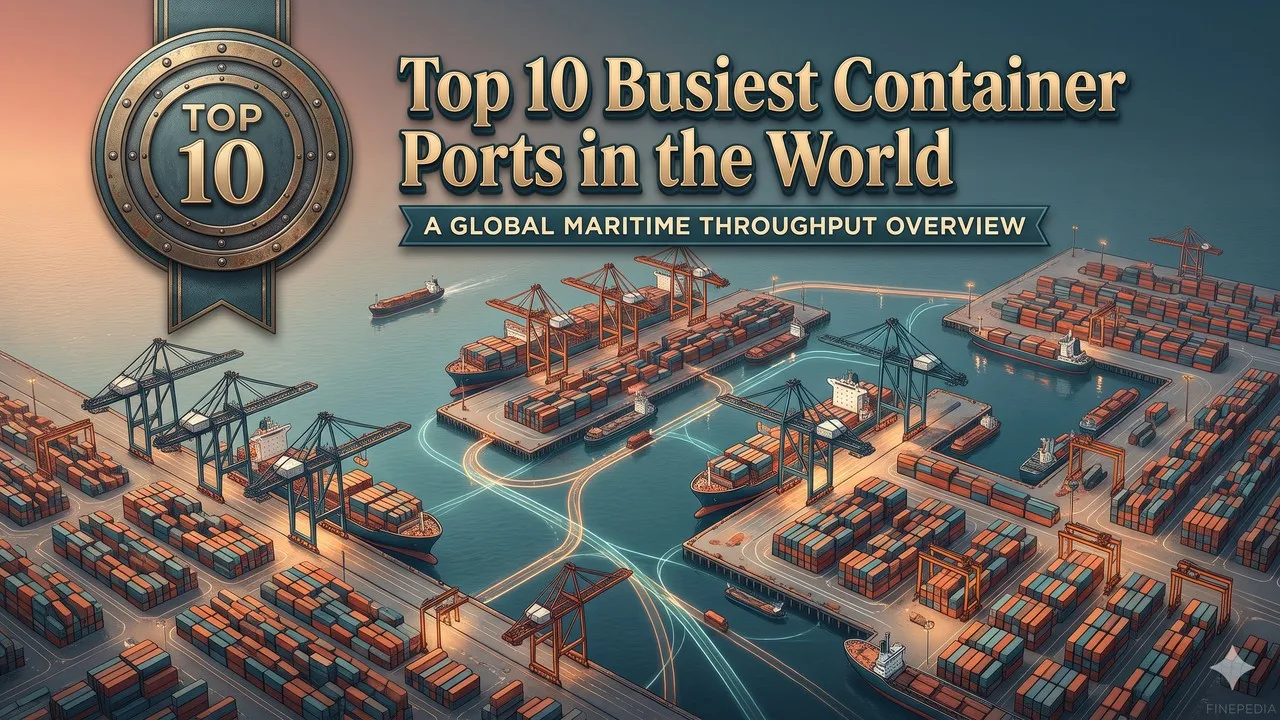
The busiest container ports ranked here use dated twenty-foot equivalent unit throughput for the 2024 calendar year, with later official 2025 totals labelled. Rank follows calendar-year container throughput in twenty-foot equivalent units, using 2024 as the ranking year because that year is fully reported in Lloyd's List One Hundred Container Ports 2025 and is corroborated in later compiled tables, with official 2025 authority totals labelled separately where they have been published [1][2][3]. Shanghai handled 51,506,300 TEU in 2024, up 4.8 percent from 49,158,300 in 2023, according to the Lloyd's List port profile [1]. Shanghai International Port Group later posted 2025 throughput of 55.06 million TEU, about 6.9 percent higher than 2024 [2]. Mixing those two years in a single unlabelled column would be a method error, so the table ranks 2024 and records 2025 as an update.
Singapore was second in 2024, at 41,124,100 TEU in the corroborated compiled figures, and PSA later reported a preliminary 2025 total of about 44.5 million TEU [2][3]. Ningbo-Zhoushan, Shenzhen, Qingdao, Guangzhou, Busan, Tianjin, Jebel Ali in Dubai, and Port Klang complete the 2024 ten; Rotterdam sits just outside it [3]. This is a TEU list, not a cargo-tonnage list, and it does not copy port or operator logos in the featured image.
Key Facts
The 2024 figures used here are 51,506,300 TEU for Shanghai, 41,124,100 for Singapore, 39,300,000 for Ningbo-Zhoushan, 33,400,000 for Shenzhen, 30,870,000 for Qingdao, 26,070,000 for Guangzhou, 24,402,020 for Busan, 23,300,000 for Tianjin, 15,536,000 for Jebel Ali, and 14,644,527 for Port Klang [1][3]. Compiled 2025 totals later published for the same ports include about 55,062,500 TEU for Shanghai, 44,663,710 for Singapore, 43,872,000 for Ningbo-Zhoushan, 35,408,400 for Shenzhen, 32,893,000 for Qingdao, 27,680,000 for Guangzhou, 24,880,000 for Busan, 24,032,900 for Tianjin, 15,552,000 for Jebel Ali, and 15,138,772 for Port Klang, with Rotterdam at 14,244,954 still eleventh on that later year [3]. Rank 1 is the outstanding official 2024 TEU total, which is also the only port whose operator has a widely cited official 2025 figure above 55 million TEU.
A preliminary operator figure and a later compiled figure can differ by a few hundred thousand TEU, as with Singapore's 2025 totals, and that difference is labelled rather than hidden [2][3]. The table is the official spine: 2024 first, 2025 update second, and no unsourced "biggest port by ships" claim is smuggled in as a TEU fact.
Busiest Container Ports at a Glance
| Rank | Port | 2024 TEU | Later 2025 note |
|---|---|---|---|
| 1 | Shanghai | 51,506,300 | Official SIPG 2025 total 55.06 million TEU |
| 2 | Singapore | 41,124,100 | PSA preliminary 2025 about 44.5 million; later compiled 44,663,710 |
| 3 | Ningbo-Zhoushan | 39,300,000 | Later compiled 2025 total 43,872,000 |
| 4 | Shenzhen | 33,400,000 | Later compiled 2025 total 35,408,400 |
| 5 | Qingdao | 30,870,000 | Later compiled 2025 total 32,893,000 |
| 6 | Guangzhou | 26,070,000 | Later compiled 2025 total 27,680,000 |
| 7 | Busan | 24,402,020 | Later compiled 2025 total 24,880,000 |
| 8 | Tianjin | 23,300,000 | Later compiled 2025 total 24,032,900 |
| 9 | Jebel Ali, Dubai | 15,536,000 | Later compiled 2025 total 15,552,000 |
| 10 | Port Klang | 14,644,527 | Later compiled 2025 total 15,138,772; Rotterdam remains just outside the ten |
1. Shanghai
The Port of Shanghai handled 51,506,300 TEU in 2024, up 4.8 percent from 49,158,300 in 2023, according to Lloyd's List, and it is the outstanding official 2024 container total [1]. Shanghai International Port Group later posted 2025 throughput of 55.06 million TEU, about 6.9 percent higher, with international transshipment and the Yangshan area contributing a larger share [2]. Those two years are not mixed in the rank column. This article records dated TEU, not a skyline, and it does not copy operator logos.
It is first as the outstanding official 2024 TEU port, a labelled 51.5-million figure with a later official 2025 update, and the documentary centre of this ten [1][2]. A later official revision of a few thousand TEU will belong in a revision of the cell.
Lloyd's List and the official SIPG 2025 total are the sources [1][2].
2. Singapore
The Port of Singapore handled 41,124,100 TEU in 2024 in the corroborated compiled figures, second in the ranking year, and later 2025 totals are about 44.5 million in PSA's preliminary report and 44,663,710 in a later compiled table [2][3]. The difference of a few hundred thousand TEU between a preliminary operator figure and a later compilation is labelled. The port remains second in both the 2024 ranking year and the later 2025 updates cited here. This article records dated TEU, not a connectivity index.
It is second as the outstanding official 2024 TEU port after Shanghai, a labelled 41.1-million figure with a later 2025 update, and a necessary counterpart to Shanghai [2][3]. A later final official figure will belong in a revision of the 2025 cell.
Related: Top 10 Most Bizarre Phobias: Strange Fears That Exist
Compiled 2024 figures and later official and compiled 2025 totals are the sources [2][3].
3. Ningbo-Zhoushan
Ningbo-Zhoushan handled 39,300,000 TEU in 2024 and a later compiled 43,872,000 TEU in 2025, remaining third in both years cited here [3]. The port is a combined official Chinese port name, not two silent ranks. The 2024-to-2025 rise is large, but it does not overtake Singapore in the figures used for this article. This article records dated TEU.
It is third as the outstanding official 2024 TEU port after Singapore, a labelled 39.3-million figure with a later 2025 update, and a necessary counterpart to Shanghai [3]. A later official authority total will belong in a revision of the cell.
Corroborated compiled TEU tables are the source [3].
4. Shenzhen
The Port of Shenzhen handled 33,400,000 TEU in 2024 and a later compiled 35,408,400 TEU in 2025, remaining fourth in both years cited here [3]. The figure is a port total, not a single terminal. This article records dated TEU. It is a Pearl River counterpart to Guangzhou, not a second Shanghai.
It is fourth as the outstanding official 2024 TEU port in that mid-30-million band, a labelled figure with a later 2025 update, and a necessary counterpart to Guangzhou [3]. A later official revision will belong in a revision of the cell.
Related: Top 10 Oldest Buildings in the World
Corroborated compiled TEU tables are the source [3].
5. Qingdao
The Port of Qingdao handled 30,870,000 TEU in 2024 and a later compiled 32,893,000 TEU in 2025, remaining fifth in both years cited here [3]. The figure is a port total. This article records dated TEU. It sits above Guangzhou and below Shenzhen in this method.
It is fifth as the outstanding official 2024 TEU port just above 30 million, a labelled figure with a later 2025 update, and a necessary northern-China counterpart to Tianjin [3]. A later official revision will belong in a revision of the cell.
Corroborated compiled TEU tables are the source [3].
6. Guangzhou
The Port of Guangzhou handled 26,070,000 TEU in 2024 and a later compiled 27,680,000 TEU in 2025, remaining sixth in both years cited here [3]. The figure is a port total, not a city-skyline claim. This article records dated TEU. It is a Pearl River counterpart to Shenzhen, not a duplicate of that port.
It is sixth as the outstanding official 2024 TEU port in the mid-20-million band, a labelled figure with a later 2025 update, and a necessary counterpart to Shenzhen [3]. A later official revision will belong in a revision of the cell.
Corroborated compiled TEU tables are the source [3].
7. Busan
The Port of Busan handled 24,402,020 TEU in 2024 and a later compiled 24,880,000 TEU in 2025, remaining seventh in both years cited here and the highest non-Chinese port after Singapore in this ten [3]. The figure is a port total. This article records dated TEU. It sits just above Tianjin in 2024.
Related: Top 10 Tallest Buildings in the World
It is seventh as the outstanding official 2024 TEU port in Korea, a labelled 24.4-million figure with a later 2025 update, and a necessary counterpart to the Chinese mid-20-million ports [3]. A later official revision will belong in a revision of the cell.
Corroborated compiled TEU tables are the source [3].
8. Tianjin
The Port of Tianjin handled 23,300,000 TEU in 2024 and a later compiled 24,032,900 TEU in 2025, remaining eighth in both years cited here [3]. The figure is a port total. This article records dated TEU. It is a northern-China counterpart to Qingdao, not a second Beijing claim.
It is eighth as the outstanding official 2024 TEU port just below Busan, a labelled 23.3-million figure with a later 2025 update, and a necessary counterpart to Qingdao [3]. A later official revision will belong in a revision of the cell.
Corroborated compiled TEU tables are the source [3].
9. Jebel Ali, Dubai
Jebel Ali, the official container port of Dubai, handled 15,536,000 TEU in 2024 and a later compiled 15,552,000 TEU in 2025, remaining ninth in both years cited here and the highest official Gulf figure in this ten [3]. The 2025 rise is small in these figures and is labelled. This article records dated TEU for the port, not a city tourism list, and it does not treat the port as a gambling or skyline rerun.
It is ninth as the outstanding official 2024 TEU port outside East Asia in this ten, a labelled 15.5-million figure, and a necessary counterpart to Port Klang [3]. A later official authority total will belong in a revision of the cell.
Related: Top 10 Facts About Dogs
Corroborated compiled TEU tables are the source [3].
10. Port Klang
Port Klang handled 14,644,527 TEU in 2024 and a later compiled 15,138,772 TEU in 2025, remaining tenth in both years cited here, just above Rotterdam's later compiled 2025 total of 14,244,954 TEU [3]. Rotterdam is therefore a near-eleventh, not a silent extra rank. This article records dated TEU. The port is Malaysia's outstanding official entry in this method.
It is tenth as the outstanding official 2024 TEU port that closes the ten, a labelled 14.6-million figure with a later 2025 update, and a necessary counterpart to Jebel Ali [3]. A later official figure that swapped it with Rotterdam would belong in a revision of the order.
Corroborated compiled TEU tables are the source [3].
Conclusion
A 2026 busiest-container-ports list has to rank a single dated year, keep Shanghai's 2024 total of 51,506,300 TEU and its official 2025 update of 55.06 million on the same page, and label Singapore's 2024 figure of 41,124,100 beside later 2025 totals of about 44.5 million or 44,663,710 [1][2][3]. Ningbo-Zhoushan, Shenzhen, Qingdao, Guangzhou, Busan, Tianjin, Jebel Ali, and Port Klang complete a 2024 ten in which Rotterdam remains just outside, and in which 2025 updates do not secretly replace the ranking year [3]. The useful habit is a dated TEU total, a labelled later update, and a refusal to mix years in one unlabelled column.
A later official authority revision will belong in a revision of a table cell; it will not change the method. Those dated TEU totals are the spine of the list, and they will still be the spine after a later yearbook has published a later calendar year.
- ^ [1] Lloyd's List, One Hundred Container Ports 2025, including the Shanghai profile: 51,506,300 TEU in 2024, up 4.8 percent from 49,158,300 in 2023. Lloyd's List, Shanghai
- ^ [2] Official and contemporaneous 2025 reporting of Shanghai International Port Group's 55.06 million TEU and PSA's preliminary Singapore total of about 44.5 million TEU. The Loadstar, 15 January 2026
- ^ [3] Compiled port TEU tables that corroborate the 2024 ranking-year figures used here and record later 2025 totals for the same ten ports, with Rotterdam still eleventh. World Top Container Ports





















Discussion
Log in with