








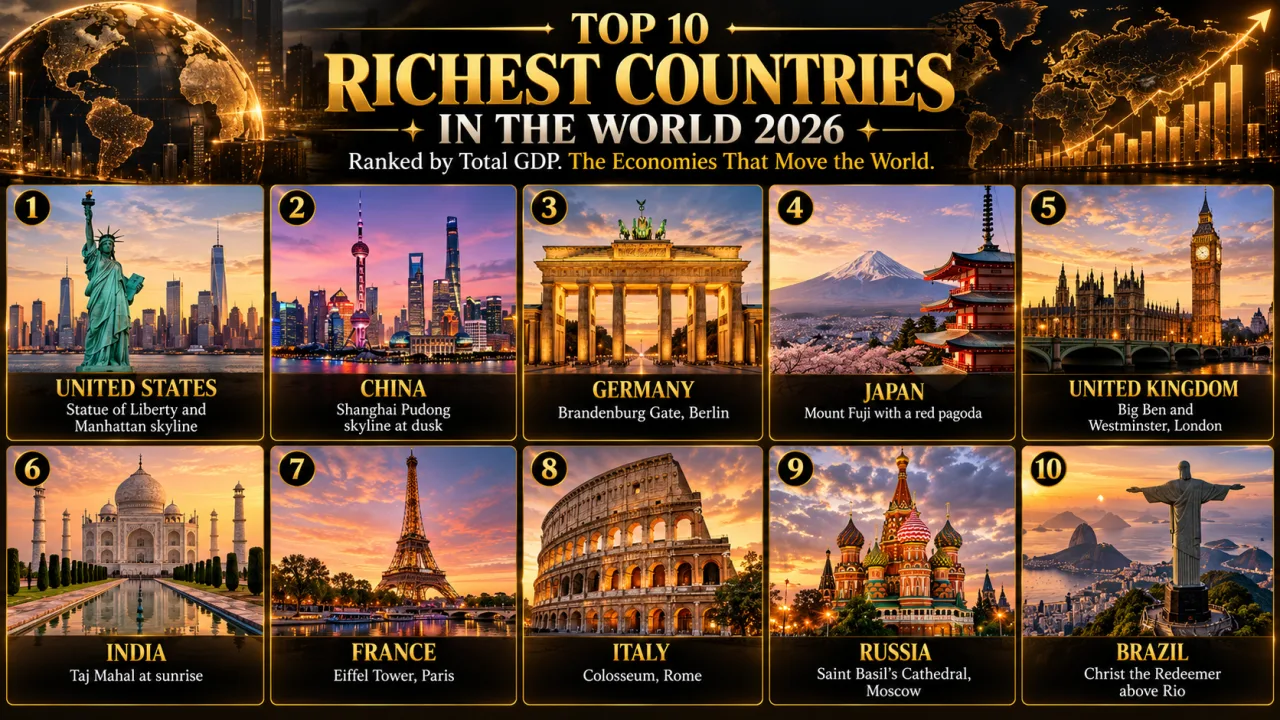
The richest countries in the world in 2026, ranked by total GDP, are led by the United States and China, according to the IMF's April 2026 economic outlook. This guide ranks the top ten by the size of their economies, then explains why a different yardstick, income per person, produces a completely different list.
Which country is "richest" depends on what you measure. This ranking uses the same test as most headline lists: gross domestic product (GDP) at current prices, converted into US dollars at market exchange rates. Put simply, it adds up the value of everything a country produces in a year and expresses it in dollars. That makes it the best measure of the sheer economic weight a nation carries in trade, finance and geopolitics.
All figures come from one source so they can be compared fairly: the International Monetary Fund's World Economic Outlook (WEO) database, April 2026 edition, as published on the IMF DataMapper. Total GDP is shown in US dollars (billions or trillions). Income per person is shown in two ways: nominal US dollars, and international dollars at purchasing power parity (PPP). Population is in millions.
One caution matters. The 2026 numbers are IMF projections for the current year, and many 2025 numbers are still IMF estimates rather than final official statistics. The IMF publishes its next full update, the October 2026 World Economic Outlook, on 13 October 2026, and rankings can shift when it does. Countries close together, especially Japan, the United Kingdom and India, can swap places on currency movements alone.
The Richest Countries at a Glance (Total Nominal GDP)
| Rank (2026) | Country | GDP 2026 (US$ projection) | GDP 2025 (US$ estimate) | Share of world GDP 2026 | Real growth 2026 (projection) |
|---|---|---|---|---|---|
| 1 | United States | $32.38 trillion | $30.77 trillion | 25.6% | 2.3% |
| 2 | China | $20.85 trillion | $19.63 trillion | 16.5% | 4.4% |
| 3 | Germany | $5.45 trillion | $5.05 trillion | 4.3% | 0.8% |
| 4 | Japan | $4.38 trillion | $4.44 trillion | 3.5% | 0.7% |
| 5 | United Kingdom | $4.26 trillion | $4.00 trillion | 3.4% | 0.8% |
| 6 | India | $4.15 trillion | $3.92 trillion | 3.3% | 6.5% |
| 7 | France | $3.60 trillion | $3.37 trillion | 2.8% | 0.9% |
| 8 | Italy | $2.74 trillion | $2.55 trillion | 2.2% | 0.5% |
| 9 | Russia | $2.66 trillion | $2.59 trillion | 2.1% | 1.1% |
| 10 | Brazil | $2.64 trillion | $2.28 trillion | 2.1% | 1.9% |
Source: IMF World Economic Outlook database, April 2026 (indicators NGDPD and NGDP_RPCH). World GDP for 2026 is projected at about $126.3 trillion. Shares are calculated from those IMF figures.
Two points stand out. First, the gap at the top is enormous: the United States and China together account for roughly 42% of world output measured this way, while number three, Germany, is about a sixth the size of the US economy. Second, the bottom of the table is crowded. Russia and Brazil are separated by only about $20 billion, and Canada ($2.51 trillion) sits just outside the top ten in 2026. On the IMF's 2025 estimates, Canada was tenth and Brazil eleventh, while Russia was eighth and Italy ninth.
GDP Rankings Explained: Total GDP, Per Capita and PPP
Three numbers dominate debates about national wealth, and each answers a different question.
Total Nominal GDP: How Big Is the Economy?
Nominal GDP is the market value of all final goods and services produced inside a country in one year, at the prices of that year, converted to US dollars at market exchange rates. It is the right measure for questions about economic weight: how large a market is, how much a government can tax, how much a country can spend on defence or aid, and how much influence it has in trade talks.
Its weakness is that it says nothing about how many people share that output. A country of 1.4 billion people and a country of 70 million can have similar totals while living standards differ enormously. Exchange rates also make it volatile. If a currency falls 10% against the dollar, nominal GDP in dollars drops by roughly the same amount even if nothing changes inside the country.
GDP Per Capita: How Much Output per Person?
GDP per capita divides total GDP by population. It is the most common shorthand for average prosperity, and it changes the picture completely. India is the sixth-largest economy on the total measure, yet on the IMF's 2026 projections its output per person is about $2,813, placing it around 150th out of 190 economies with data.
Per capita GDP is still an average. It does not show how income is distributed, and in a few economies it includes large profits that belong to foreign owners. That caveat matters for Ireland, as explained below.
GDP at Purchasing Power Parity: What Can the Money Buy?
Purchasing power parity (PPP) adjusts for the fact that the same dollar buys more in some countries than in others. A haircut, a bus ride or a restaurant meal usually costs far less in Delhi than in Zurich. PPP converts each economy at a rate that equalises the cost of a common basket of goods and services, so the result reflects real volume rather than currency value. The price data behind these conversions come from the International Comparison Program, coordinated by the World Bank.
PPP figures are expressed in "international dollars". By construction, an international dollar has the same buying power as a US dollar in the United States, which is why the US shows identical nominal and PPP per capita figures. On a PPP basis, emerging economies with low prices look much larger. In the IMF's 2026 projections, China's PPP-adjusted GDP (about $44.3 trillion) is larger than the US total, and India ranks third in the world, behind China and the United States.
Side-by-Side: The Top 10 on All Three Measures
| Country | Total GDP 2026 (US$) | GDP per capita 2026 (US$, nominal) | GDP per capita 2026 (PPP, int'l $) | Rank by total PPP GDP 2026 |
|---|---|---|---|---|
| United States | $32.38 trillion | $94,430 | $94,430 | 2 |
| China | $20.85 trillion | $14,874 | $31,596 | 1 |
| Germany | $5.45 trillion | $65,303 | $76,747 | 6 |
| Japan | $4.38 trillion | $35,703 | $59,207 | 5 |
| United Kingdom | $4.26 trillion | $61,056 | $67,585 | 10 |
| India | $4.15 trillion | $2,813 | $12,801 | 3 |
| France | $3.60 trillion | $52,083 | $68,567 | 9 |
| Italy | $2.74 trillion | $46,505 | $65,761 | 12 |
| Russia | $2.66 trillion | $18,525 | $52,479 | 4 |
| Brazil | $2.64 trillion | $12,313 | $24,428 | 8 |
Source: IMF WEO April 2026 (NGDPD, NGDPDPC, PPPPC, PPPGDP). All 2026 values are IMF projections; per capita values are rounded to the nearest dollar.
Why Tiny Countries Top the Per Capita Lists
Sort the IMF data by income per person and none of the ten largest economies comes first. The 2026 projections for nominal GDP per capita are led by Liechtenstein, Luxembourg, Ireland, Switzerland, Iceland, Singapore and Norway, with the United States in eighth place.
| Economy | GDP per capita 2026 (US$, nominal) | GDP per capita 2026 (PPP, int'l $) | Population 2026 (millions) | Main reason for high figure |
|---|---|---|---|---|
| Luxembourg | $158,733 | $156,719 | 0.70 | Financial centre; many workers commute from neighbouring countries |
| Ireland | $140,186 | $159,129 | 5.56 | Profits and intellectual property of multinational firms booked in Ireland |
| Switzerland | $126,177 | $105,680 | 9.09 | Banking, pharmaceuticals, precision manufacturing, strong franc |
| Singapore | $107,758 | $173,708 | 6.12 | Trade, shipping and finance hub |
| Norway | $105,877 | $115,548 | 5.66 | Oil and gas wealth |
| Qatar | $68,138 | $112,312 | 3.19 | Natural gas exports |
| United States | $94,430 | $94,430 | 342.94 | Large, diversified, high-productivity economy |
Source: IMF WEO April 2026 projections. Liechtenstein, with a projected $226,809 per person, tops the nominal list but is a micro-state with a population of only around 40,000.
Several forces push small economies to the top:
- Small denominators. A modest number of high-value businesses, divided among a few hundred thousand or a few million residents, produces a very large average.
- Cross-border commuters. Luxembourg's output includes work done by many people who live in France, Belgium and Germany. Their production counts in Luxembourg's GDP, but they are not counted in its population.
- Natural resources. Norway and Qatar earn large revenues from oil and gas spread across small populations.
- Financial and corporate hubs. Low or stable taxes, strong legal systems and open capital markets attract headquarters, funds and trading activity, as in Singapore, Switzerland and Luxembourg.
- Multinational accounting. Ireland's GDP includes large profits generated by foreign-owned multinationals, much of which flows back to owners abroad.
Ireland is the clearest example of why GDP per capita can mislead. The country's Central Statistics Office (CSO) publishes an alternative measure, modified gross national income (GNI*), designed to strip out these globalisation effects. In its walk-through for 2023, the CSO shows GDP of about €510 billion but GNI* of about €291 billion, a gap of more than 40%. Irish residents are prosperous, but not as rich as the headline GDP figure suggests.
1. United States
| Attribute | Details |
|---|---|
| Capital | Washington, D.C. |
| Population (2026) | 342.9 million |
| Total GDP (2026) | $32.38 trillion |
| GDP per capita (2026) | $94,430 (nominal); $94,430 (PPP) |
| Currency | US dollar (USD) |
| Main wealth drivers | Services, technology, finance, health care, energy, consumer spending |
Why It Is the Richest Economy
The United States has been the world's largest economy by nominal GDP for more than a century, and on the IMF's 2026 projections it produces about a quarter of global output with only around 4% of the world's population. Its lead over China in dollar terms has stayed large in recent years even though China grew faster, because the dollar has been strong and US nominal growth has remained solid.
Size alone does not explain it. The US combines a large internal market of more than 340 million consumers with high productivity per worker. Its output per person, $94,430 in 2026 on the IMF's projection, is the highest of any large economy and is exceeded only by much smaller countries.
Economy Drivers
- Services account for the great majority of output, led by finance, real estate, professional services, health care and retail.
- Technology companies headquartered in the US dominate global software, cloud computing, semiconductor design, online platforms and artificial intelligence.
- Deep capital markets. The New York Stock Exchange and Nasdaq are the two largest stock exchanges in the world by market value, giving firms access to large pools of investment.
- Energy. The US is the world's largest producer of both crude oil and natural gas, a result of the shale revolution.
- Consumer spending is the single largest component of demand, which makes household confidence a key driver of growth.
Challenges
- High public debt and persistent federal budget deficits.
- Income and wealth inequality that is high by the standards of advanced economies.
- Trade tensions and tariffs, which affect supply chains and prices.
- Rising health care costs and housing affordability pressures in major cities.
Lesser-Known Facts
- The US dollar is the main currency in which central banks around the world hold their foreign exchange reserves, according to the IMF's COFER data, a position that lowers US borrowing costs.
- Because the international dollar used in PPP comparisons is defined by US prices, the US nominal and PPP per capita figures are always identical.
- California's economy alone would rank among the largest in the world if it were a separate country.
2. China
| Attribute | Details |
|---|---|
| Capital | Beijing |
| Population (2026) | 1,401.9 million |
| Total GDP (2026) | $20.85 trillion |
| GDP per capita (2026) | $14,874 (nominal); $31,596 (PPP) |
| Currency | Renminbi; unit: yuan (CNY) |
| Main wealth drivers | Manufacturing, exports, infrastructure, technology, domestic consumption |
Why It Is So Wealthy in Total
China's rise is the largest economic transformation of modern times. After market reforms began in 1978, decades of rapid growth turned a largely rural, low-income country into the world's second-largest economy at market exchange rates. On PPP terms the IMF already ranks China first, with projected 2026 output of about $44.3 trillion in international dollars.
Its wealth is "total" rather than "per person". Spread across 1.4 billion people, China's nominal GDP per capita of $14,874 in 2026 is about one-sixth of the US level, and ranks roughly 77th in the IMF dataset. The country is rich as a state and as an economy, while average household incomes are still those of an upper-middle-income nation.
Economy Drivers
- Manufacturing. China is the world's largest manufacturer and the largest exporter of goods, producing everything from steel and ships to smartphones.
- Green technology. Chinese firms lead global production of solar panels, batteries and electric vehicles.
- Infrastructure and investment. High-speed rail, ports, power grids and housing were built at a scale no other country has matched.
- A huge domestic market that supports large national champions in e-commerce, payments and consumer technology.
Challenges
- A prolonged property-sector slump that has hurt household wealth and local government finances.
- A shrinking and ageing population; China's population has declined since 2022.
- Weak household consumption relative to the size of the economy.
- Trade frictions and export controls involving the United States and other partners.
- Real growth has slowed: the IMF projects 4.4% for 2026, down from 5.0% in 2025.
Lesser-Known Facts
- China's currency has two names: renminbi ("people's currency") is the currency, and the yuan is its unit of account.
- China is among the world's three largest net creditor nations, with net external assets of ¥516.3 trillion at the end of 2024 according to figures reported by Japan's Ministry of Finance.
- On the IMF's PPP measure, China overtook the United States as the largest economy in the mid-2010s.
3. Germany
| Attribute | Details |
|---|---|
| Capital | Berlin |
| Population (2026) | 83.5 million |
| Total GDP (2026) | $5.45 trillion |
| GDP per capita (2026) | $65,303 (nominal); $76,747 (PPP) |
| Currency | Euro (EUR) |
| Main wealth drivers | Automobiles, machinery, chemicals, engineering, exports |
Why It Is Rich
Germany is Europe's largest economy and the world's third-largest, having overtaken Japan in 2023 on the IMF's dollar figures. Its prosperity rests on a manufacturing base that has stayed strong while many advanced economies shifted towards services. German firms are known for high-value engineered products that command premium prices around the world.
The IMF projects Germany's GDP at $5.45 trillion in 2026, up from $5.05 trillion in 2025. Most of that increase comes from price and exchange-rate effects rather than extra output, since the IMF projects real growth of just 0.8%.
Economy Drivers
- The Mittelstand: thousands of small and mid-sized, often family-owned companies, many of them world leaders in narrow industrial niches. The management writer Hermann Simon called such firms "hidden champions".
- Car-making, with globally known manufacturers and a deep supplier network.
- Machinery, chemicals and pharmaceuticals.
- A dual vocational training system that combines classroom learning with paid apprenticeships in firms.
- Large export surpluses built on demand from Europe, the United States and China.
Challenges
- High energy costs after the loss of cheap Russian pipeline gas in 2022.
- Competition from Chinese manufacturers in cars and machinery, including electric vehicles.
- An ageing workforce and skills shortages.
- Two years of contraction before a slow recovery; real growth was only 0.2% in 2025 according to IMF estimates.
Lesser-Known Facts
- In March 2025 the Bundestag amended the Basic Law to exempt defence spending above 1% of GDP from the constitutional "debt brake" and to create a €500 billion special fund for infrastructure and climate investment, ending decades of strict fiscal restraint.
- At the end of 2024 Germany overtook Japan as the world's largest net creditor nation, with net external assets of €3,452 billion according to the Bundesbank, the first time it held that position since 1991.
4. Japan
| Attribute | Details |
|---|---|
| Capital | Tokyo |
| Population (2026) | 122.7 million |
| Total GDP (2026) | $4.38 trillion |
| GDP per capita (2026) | $35,703 (nominal); $59,207 (PPP) |
| Currency | Japanese yen (JPY) |
| Main wealth drivers | Advanced manufacturing, automobiles, electronics, robotics, overseas investment income |
Why It Is Rich
Japan was the world's second-largest economy for decades until China passed it around 2010, and it remains among the most technologically advanced nations. Its companies built global leadership in cars, electronics, industrial robots and precision components, and Japanese households and firms have accumulated very large savings and foreign assets.
Japan is the only country in this top ten whose dollar GDP is projected to shrink between 2025 and 2026, from $4.44 trillion to $4.38 trillion. That does not mean the economy contracts in real terms; the IMF projects 0.7% real growth. The fall reflects a weak yen, which reduces the dollar value of everything Japan produces.
Economy Drivers
- Automobiles and auto parts, with some of the world's largest carmakers.
- Electronics components, semiconductor materials and manufacturing equipment.
- Industrial robots and factory automation.
- Income from overseas investments, which supports Japan's current account.
- Tourism, which has grown strongly as the weak yen makes Japan cheaper for foreign visitors.
Challenges
- A shrinking and ageing population: the IMF projects 122.7 million people in 2026, down from 123.3 million in 2025.
- Very high government debt relative to the size of the economy.
- Low productivity growth in services.
- Currency weakness that raises import costs for food and energy.
Lesser-Known Facts
- Japan's net external assets reached a record ¥533.1 trillion at the end of 2024, according to its Ministry of Finance, yet Japan lost the title of world's largest creditor to Germany for the first time in 34 years.
- Kongō Gumi, a temple construction company founded in 578, is widely cited as one of the oldest continuously operating businesses in the world.
- On PPP-adjusted GDP, Japan ranks fifth in the world in the IMF's 2026 projections, behind China, the US, India and Russia.
5. United Kingdom
| Attribute | Details |
|---|---|
| Capital | London |
| Population (2026) | 69.9 million |
| Total GDP (2026) | $4.26 trillion |
| GDP per capita (2026) | $61,056 (nominal); $67,585 (PPP) |
| Currency | Pound sterling (GBP) |
| Main wealth drivers | Financial services, professional services, education, creative industries, pharmaceuticals, aerospace |
Why It Is Rich
The United Kingdom was the first country to industrialise, and today it is one of the most service-oriented major economies. London is one of the world's leading financial centres, and British firms are major exporters of banking, insurance, legal, consulting and other business services.
On the IMF's April 2026 numbers the UK ranks fifth, ahead of India, with GDP of $4.26 trillion in 2026 compared with India's $4.15 trillion. The two have traded places several times in recent years, mostly because of exchange-rate swings.
Economy Drivers
- Financial and professional services centred on the City of London and Canary Wharf.
- World-ranked universities, which attract international students and research investment.
- Creative industries, including film, television, music, publishing and video games.
- Life sciences and pharmaceuticals.
- Aerospace and defence manufacturing.
Challenges
- Weak productivity growth since the 2008 financial crisis.
- Trade frictions with the European Union after Brexit.
- High public debt and pressure on public services.
- Slow growth: the IMF projects 0.8% real growth in 2026.
Lesser-Known Facts
- The Bank of England, founded in 1694, is one of the oldest central banks in the world.
- Pound sterling is often described as the oldest currency still in continuous use.
- The UK's nominal GDP per capita ($61,056) is projected to be lower than Germany's ($65,303) but slightly higher than Canada's in 2026.
6. India
| Attribute | Details |
|---|---|
| Capital | New Delhi |
| Population (2026) | 1,476.6 million |
| Total GDP (2026) | $4.15 trillion |
| GDP per capita (2026) | $2,813 (nominal); $12,801 (PPP) |
| Currency | Indian rupee (INR) |
| Main wealth drivers | IT and business services, domestic consumption, manufacturing, finance, agriculture |
Why It Ranks So High
India is the world's most populous country and its fastest-growing major economy. The IMF projects real growth of 6.5% in 2026 after 7.6% in 2025, far ahead of every other country in this top ten. Its sheer size and speed of growth explain why it ranks sixth by total output even though average income is low.
Economy Drivers
- IT services and global capability centres serving companies worldwide.
- A large and young domestic consumer market.
- Public investment in roads, railways, ports and airports.
- Digital public infrastructure, including the Aadhaar identity system and UPI payments.
- Pharmaceuticals, with India a major global supplier of generic medicines.
Challenges
- Low income per person and the need to create jobs for a large young workforce.
- Dependence on imported crude oil, which pressures the rupee when oil prices rise.
- A persistent trade deficit.
- A large informal sector and a big share of employment still in agriculture.
Lesser-Known Facts
- India is third in the world on PPP-adjusted GDP in the IMF's 2026 projections, ahead of Japan, Germany and Russia.
- UPI, launched in 2016, has become one of the largest real-time payment systems in the world.
7. France
| Attribute | Details |
|---|---|
| Capital | Paris |
| Population (2026) | 69.0 million |
| Total GDP (2026) | $3.60 trillion |
| GDP per capita (2026) | $52,083 (nominal); $68,567 (PPP) |
| Currency | Euro (EUR) |
| Main wealth drivers | Luxury goods, aerospace, tourism, agriculture and food, energy, services |
Why It Is Rich
France combines a large service sector with world-class industries in aerospace, luxury goods, nuclear power, pharmaceuticals and agri-food. It is also one of the world's most visited countries, drawing tens of millions of international tourists each year. The IMF projects French GDP at $3.60 trillion in 2026, the second-largest economy in the European Union after Germany.
Economy Drivers
- Luxury and fashion, home to the world's largest luxury group and many leading fashion houses.
- Aerospace, with Toulouse as the main base of Airbus.
- Nuclear power, which supplies a larger share of electricity in France than in any other major economy.
- Agriculture and food, with France the EU's largest agricultural producer.
- Tourism and hospitality.
Challenges
- High public spending and debt, and political difficulty in passing budgets.
- Slow growth, projected at 0.9% in 2026.
- Unemployment that has historically been higher than in Germany or the UK.
Lesser-Known Facts
- Through its overseas territories in the Pacific, Indian Ocean and Caribbean, France controls one of the largest maritime exclusive economic zones in the world.
- France's PPP per capita income ($68,567) is projected to be slightly higher than the UK's ($67,585) in 2026, even though the UK's nominal per capita figure is higher.
8. Italy
| Attribute | Details |
|---|---|
| Capital | Rome |
| Population (2026) | 58.9 million |
| Total GDP (2026) | $2.74 trillion |
| GDP per capita (2026) | $46,505 (nominal); $65,761 (PPP) |
| Currency | Euro (EUR) |
| Main wealth drivers | Manufacturing, machinery, fashion, food and wine, tourism |
Why It Is Rich
Italy has one of Europe's largest manufacturing sectors, built on industrial districts in the north where clusters of specialised firms produce machinery, textiles, furniture, ceramics and food products. Brands in fashion, design and cars give Italian goods a premium reputation, and its art cities and coastlines make tourism a major earner.
Economy Drivers
- Machinery and industrial equipment exports.
- Fashion, leather goods and design.
- Food and wine, with many products carrying protected-origin status in the EU.
- Tourism, supported by one of the largest collections of UNESCO World Heritage Sites of any country.
Challenges
- One of the highest ratios of public debt to GDP in the euro area.
- Long-term low productivity growth; the IMF projects only 0.5% real growth in both 2025 and 2026.
- An ageing and slightly shrinking population.
- A persistent economic gap between the richer north and the south.
Lesser-Known Facts
- Among national central banks, Italy's holds the third-largest official gold reserves in the world, behind those of the United States and Germany.
- Italy and Russia are separated by only about $80 billion in projected 2026 GDP, so their order could change in the next IMF update.
9. Russia
| Attribute | Details |
|---|---|
| Capital | Moscow |
| Population (2026) | 143.4 million |
| Total GDP (2026) | $2.66 trillion |
| GDP per capita (2026) | $18,525 (nominal); $52,479 (PPP) |
| Currency | Russian ruble (RUB) |
| Main wealth drivers | Oil, natural gas, metals, grain, defence industry |
Why It Is Rich
Russia's economy rests on natural resources. It is one of the world's largest producers of oil and natural gas and a major exporter of metals, coal, fertiliser and wheat. As the largest country in the world by area, it holds vast reserves of energy and minerals.
The gap between its nominal and PPP figures is one of the widest in this list. Nominal GDP per capita is projected at $18,525 in 2026, but on PPP terms it is $52,479, reflecting low domestic prices. On total PPP GDP the IMF ranks Russia fourth in the world.
Economy Drivers
- Oil and gas production and exports, increasingly to Asian buyers.
- Metals and mining, including aluminium, nickel and palladium.
- Agriculture, especially wheat exports.
- Military spending, which has boosted industrial output since 2022.
Challenges
- Western sanctions imposed after the invasion of Ukraine in 2022, which restrict access to technology, finance and markets.
- High inflation and high interest rates.
- Heavy dependence on commodity prices.
- A declining population and labour shortages.
- Russian economic data have become less transparent since 2022, so all estimates carry extra uncertainty.
Lesser-Known Facts
- Russia's ranking in dollar terms is highly sensitive to the ruble exchange rate, which has swung sharply in recent years.
- On the IMF's 2025 estimates Russia was eighth, ahead of Italy; on the 2026 projections it slips to ninth.
10. Brazil
| Attribute | Details |
|---|---|
| Capital | Brasília |
| Population (2026) | 214.1 million |
| Total GDP (2026) | $2.64 trillion |
| GDP per capita (2026) | $12,313 (nominal); $24,428 (PPP) |
| Currency | Brazilian real (BRL) |
| Main wealth drivers | Agribusiness, mining, offshore oil, manufacturing, services |
Why It Is Rich
Brazil is the largest economy in Latin America and one of the world's great agricultural and mineral powers. Its farms and ranches feed much of the world, its mines supply iron ore to global steelmakers, and its offshore oil fields have made it a major crude producer.
Brazil re-enters the top ten in 2026 on the IMF's projections. Its dollar GDP is projected to rise from $2.28 trillion in 2025 to $2.64 trillion, the largest percentage jump in this list. With real growth projected at only 1.9%, most of that rise reflects prices and the exchange rate rather than extra output.
Economy Drivers
- Agribusiness: Brazil is the world's largest exporter of soybeans and the largest producer of coffee.
- Mining, led by iron ore.
- Deep-water "pre-salt" oil fields off the south-east coast.
- Aircraft manufacturing through Embraer, one of the largest makers of regional jets.
- Biofuels, with sugarcane ethanol widely used in its vehicles.
Challenges
- High interest rates and public debt.
- Inequality that is high by international standards.
- Infrastructure gaps and a complex tax system.
- Pressure to protect the Amazon rainforest while expanding agriculture.
Lesser-Known Facts
- Pix, an instant payment system launched by Brazil's central bank in 2020, became one of the most widely used payment methods in the country within a few years.
- Brazil, Russia and Canada are separated by less than $150 billion in projected 2026 GDP, so tenth place is the most contested position in the ranking.
Just Outside the Top 10
Canada is the eleventh-largest economy in the IMF's 2026 projections, at $2.51 trillion, with a much higher income per person ($60,305) than Brazil or Russia. It was tenth on the 2025 estimates. Next come Australia ($2.12 trillion), Mexico ($2.12 trillion), Spain ($2.09 trillion) and South Korea ($1.93 trillion).
Where Does India Stand?
For Indian readers, the answer depends entirely on the measure:
| Measure (IMF WEO April 2026, 2026 projection) | India's figure | India's approximate world rank |
|---|---|---|
| Total nominal GDP | $4.15 trillion | 6th |
| Total GDP at PPP | $18.90 trillion (international $) | 3rd |
| Nominal GDP per capita | $2,813 | About 150th of 190 economies |
| PPP GDP per capita | $12,801 (international $) | About 125th of 191 economies |
| Real GDP growth | 6.5% | Fastest among the ten largest economies |
The April 2026 WEO moved India from fifth to sixth place, behind the United Kingdom. Indian media coverage, including India Today and The Economic Times, attributed the change mainly to the rupee's fall against the dollar, together with revisions to GDP estimates, rather than to slower growth. When the rupee weakens, the dollar value of India's output falls even if production in rupee terms keeps rising. Higher crude oil prices, which raise India's import bill, added to pressure on the currency.
The longer-term outlook is different. On the same IMF dataset, India is projected to overtake Japan and the UK in 2027 with GDP of about $4.58 trillion, to pass $5 trillion in 2028, and to become the third-largest economy by 2031, ahead of Germany. These are projections, not certainties, and they depend on growth, inflation and the exchange rate.
The bigger gap is income per person. India's nominal GDP per capita is about one-thirty-third of the US figure and less than a fifth of China's. Closing that gap, rather than climbing the total GDP table, is the real measure of rising prosperity.
How the Ranking Has Shifted
| Year | 3rd | 4th | 5th | 6th | Status of data |
|---|---|---|---|---|---|
| 2023 | Germany | Japan | India | United Kingdom | IMF historical data |
| 2024 | Germany | Japan | India | United Kingdom | IMF data |
| 2025 | Germany | Japan | United Kingdom | India | Mostly IMF estimates |
| 2026 | Germany | Japan | United Kingdom | India | IMF projections |
| 2027 | Germany | India | Japan | United Kingdom | IMF projections |
Source: IMF WEO April 2026, NGDPD series. The United States and China hold first and second place in every year shown.
Frequently Asked Questions
Which is the richest country in the world in 2026?
By total economic output, the United States is the richest country, with GDP projected at $32.38 trillion in 2026 in the IMF's April 2026 World Economic Outlook. By output per person, Liechtenstein and Luxembourg rank highest, because their small populations share large financial and industrial income.
Why does the US rank first but not first in GDP per capita?
Total GDP rewards size, and the US has both high productivity and more than 340 million people. Per capita figures divide output by population, so small, specialised economies such as Luxembourg, Ireland, Switzerland, Singapore and Norway score higher. Among large economies, the US still has the highest income per person.
Is China richer than the United States?
Not in dollar terms. The IMF projects US GDP at $32.38 trillion and China's at $20.85 trillion in 2026. Adjusted for purchasing power, however, China's economy is larger, at about $44.3 trillion in international dollars. Per person, Chinese incomes remain well below American ones on both measures.
What is the difference between nominal GDP and PPP?
Nominal GDP values output at market prices and current exchange rates. PPP GDP adjusts for differences in price levels, so it shows how much an economy can actually produce and buy at home. PPP makes lower-cost countries such as India, China and Russia appear much larger than nominal figures suggest.
Why did India fall from fifth to sixth?
In the IMF's April 2026 data, India's dollar GDP fell behind the United Kingdom's mainly because the rupee weakened against the dollar, along with revisions to GDP estimates. India's real growth, projected at 6.5% in 2026, remains the fastest among the ten largest economies, and the IMF projects it moving up to fourth in 2027.
Is GDP the best measure of a country's wealth?
GDP measures annual income, not accumulated wealth such as property, savings and natural assets, and it says nothing about inequality or well-being. It remains the most widely available, comparable measure, so economists use it alongside per capita income, PPP data and indicators of health, education and inequality.
When will these rankings be updated?
The IMF updates its World Economic Outlook database twice a year, in April and October. The October 2026 edition is scheduled for release on 13 October 2026. Close positions, especially Japan, the UK and India, and Italy, Russia, Brazil and Canada, may change.
Conclusion
Measured by total output, the world's richest countries in 2026 are the United States, China, Germany, Japan, the United Kingdom, India, France, Italy, Russia and Brazil. The US and China stand far apart from everyone else, while the places from fourth to sixth and from eighth to eleventh are close enough that currency moves can reorder them within a year.
The more useful lesson is that "richest" has no single answer. Total GDP measures economic weight. GDP per capita measures average output per person, and it favours small, specialised economies such as Luxembourg, Ireland and Singapore. PPP corrects for price differences and lifts large emerging economies such as China and India. Reading all three together, with a note on whether the figures are estimates or projections, gives a far more honest picture of national wealth than any single ranking.
- International Monetary Fund, World Economic Outlook database, April 2026, via IMF DataMapper: GDP, current prices (NGDPD). https://www.imf.org/external/datamapper/NGDPD@WEO
- International Monetary Fund, World Economic Outlook database, April 2026: GDP per capita, current prices (NGDPDPC). https://www.imf.org/external/datamapper/NGDPDPC@WEO
- International Monetary Fund, World Economic Outlook database, April 2026: GDP per capita, PPP (PPPPC) and GDP, PPP (PPPGDP). https://www.imf.org/external/datamapper/PPPPC@WEO
- International Monetary Fund, World Economic Outlook database, April 2026: Population (LP) and Real GDP growth (NGDP_RPCH). https://www.imf.org/external/datamapper/NGDP_RPCH@WEO
- International Monetary Fund, World Economic Outlook, April 2026, Statistical Appendix. https://www.imf.org/-/media/files/publications/weo/2026/april/english/statsappendix.pdf
- International Monetary Fund, World Economic Outlook, October 2026 (release schedule). https://www.imf.org/en/publications/weo/issues/2026/10/13/world-economic-outlook-october-2026
- World Bank, International Comparison Program (PPP methodology). https://www.worldbank.org/en/programs/icp
- Central Statistics Office Ireland, Modified GNI explained, and Information Note: Measures of the Economy. https://www.cso.ie/en/interactivezone/statisticsexplained/nationalaccountsexplained/modifiedgni/
- Deutsche Bundesbank, Germany's international investment position at the end of 2024. https://www.bundesbank.de/en/press/press-releases/germany-s-international-investment-position-at-the-end-of-2024--967106
- Reuters, "Japan net external assets hit record, but surrenders world's top creditor spot", 27 May 2025.
- Reuters and BBC News reports on the Bundestag's debt brake reform, 18 and 21 March 2025.
- India Today, "India slips to 6th-largest economy: What IMF's latest data shows", 17 April 2026.
- The Economic Times, "India's economy slipping to 6th rank, IMF data shows, prospects bright", April 2026.














Log in with