










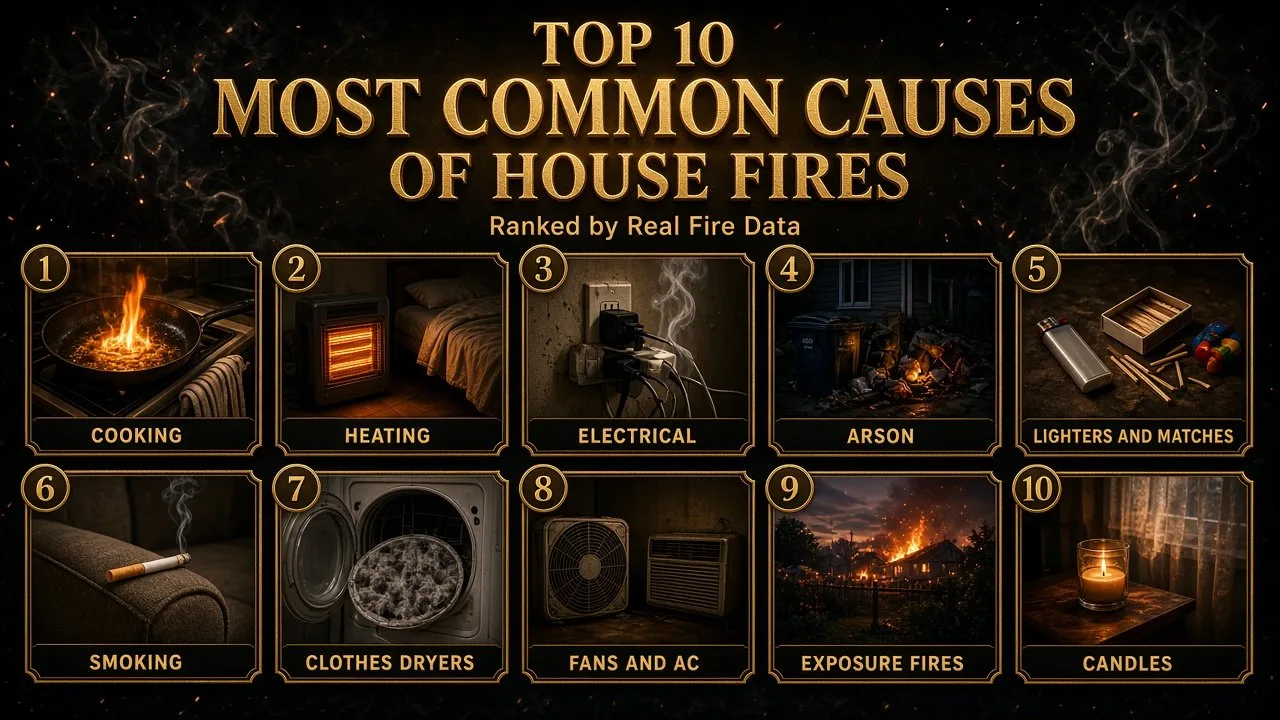
Cooking, heating equipment and electrical faults are the three most common causes of house fires, followed by arson, open flames, smoking, dryers and candles. Knowing how each one starts, and which habits stop it, is the most practical fire protection any household can have.
Most home fires are not freak accidents. They begin with ordinary equipment and everyday behaviour: a pan left on a hot burner, a space heater pushed too close to a bed, a worn extension cord hidden under a rug. Because the same few scenarios repeat year after year, fire services can measure them precisely, and that makes most of them preventable.
This ranking follows one dataset so the causes can be compared fairly: the National Fire Protection Association (NFPA) report Home Structure Fires, published in August 2025, and its Table 5, Leading Causes of Reported Home Structure Fires, which gives estimated annual averages for 2019 to 2023 in the United States. The ten causes are listed in the order of the number of fires each one started per year. NFPA builds these estimates from the US Fire Administration's National Fire Incident Reporting System (NFIRS) and its own annual survey of fire departments. "Home" covers one- and two-family houses, manufactured homes and apartments.
Two cautions apply. First, NFPA notes that its leading-cause categories come from several different data fields, so some fires can be counted in more than one category. Second, the figures cover only fires reported to fire departments; many small kitchen fires are put out by residents and never recorded. Where other datasets help, such as the UK government's fire statistics for England, they are used for context and clearly labelled.
Most Common Causes of House Fires at a Glance
| Rank | Cause | Home fires per year | Share of home fires | Deaths per year | Injuries per year |
|---|---|---|---|---|---|
| 1 | Cooking | 159,439 | 49% | 428 | 3,854 |
| 2 | Heating equipment | 64,958 | 20% | 432 | 1,527 |
| 3 | Electrical distribution, lighting and power transfer | 31,647 | 10% | 425 | 1,279 |
| 4 | Intentional fires (arson) | 24,601 | 7% | 119 | 463 |
| 5 | Lighters, matches and other small open flames | 24,336 | 7% | 287 | 1,436 |
| 6 | Smoking materials | 15,209 | 5% | 590 | 1,048 |
| 7 | Clothes dryers and washing machines | 10,263 | 3% | 19 | 222 |
| 8 | Fans and air conditioners | 7,382 | 2% | 27 | 238 |
| 9 | Exposure to another fire | 6,510 | 2% | 27 | 52 |
| 10 | Candles | 5,830 | 2% | 66 | 572 |
Source: NFPA, Home Structure Fires, Supporting Tables (August 2025), Table 5, estimated annual averages for 2019 to 2023 in the US. NFPA's group for rank 5 is "lighters, candles, or matches", so it includes the candle fires shown separately at rank 10.
Over that period, US fire departments responded to an average of 328,590 home structure fires a year. Those fires killed about 2,600 civilians, injured 10,770 and caused 8.9 billion dollars in direct property damage annually. Cooking, heating and electrical equipment alone account for nearly four in five reported home fires.
The US Fire Administration's own NFIRS estimates, which group causes slightly differently, point the same way. For 2023 it estimated 167,800 residential building fires caused by cooking, 27,900 by heating and 23,700 by electrical malfunction, with a broad "other unintentional, careless" group of 31,500 in between. Cooking was the leading cause in every year from 2014 to 2023.
Frequency vs Danger: Why the Order Changes
The number of fires a cause starts is only one way to rank it. A cause that starts few fires can still kill more people, because of where and when those fires begin.
- Fires: cooking is far ahead, with almost half of all reported home fires.
- Deaths: smoking materials lead, with about 23% of home fire deaths, even though they start only 5% of fires.
- Injuries: cooking again comes first, with 36% of injuries; NFPA's cooking report found that more than half of non-fatal cooking injuries happened when people tried to fight the fire themselves.
- Property damage: electrical distribution and lighting equipment causes the largest share, about 18%, partly because many electrical fires start in hidden spaces such as attics and wall cavities.
Deaths per 1,000 Fires
Dividing deaths by the number of fires gives a simple measure of how dangerous a typical fire of each type is. The table below uses the same NFPA annual averages.
| Cause | Deaths per 1,000 fires | Average direct damage per fire (US dollars) |
|---|---|---|
| Smoking materials | 38.8 | about 44,300 |
| Electrical distribution and lighting | 13.4 | about 50,000 |
| Lighters, candles or matches | 11.8 | about 27,700 |
| Candles | 11.3 | about 46,300 |
| Heating equipment | 6.7 | about 17,100 |
| Intentional | 4.8 | about 13,000 |
| Exposure to another fire | 4.1 | about 62,800 |
| Fans and air conditioners | 3.7 | about 35,400 |
| Cooking | 2.7 | about 7,200 |
| Clothes dryers and washers | 1.9 | about 21,400 |
Calculated from NFPA Table 5 (2019 to 2023 annual averages). Damage figures are not adjusted for inflation.
The pattern is clear. Kitchen fires are common but usually caught early, because someone is nearby and awake. Fires that start at night in a living room or bedroom, often in upholstered furniture or bedding, are rarer but far deadlier. NFPA found that only about one-fifth of home fires were reported between 11 p.m. and 7 a.m., yet those fires caused nearly half (48%) of home fire deaths.
1. Cooking
| Attribute | Details |
|---|---|
| Home fires per year | 159,439 (49% of all reported home fires) |
| Deaths per year | 428 (16% of home fire deaths) |
| Injuries per year | 3,854 (36% of home fire injuries) |
| Main danger | Cooking left unattended, especially frying |
| Peak time | 5 p.m. to 8 p.m.; Thanksgiving is the peak day in the US |
How It Starts
Cooking fires begin when food, oil or grease overheats and ignites, or when something that can burn touches a hot surface. Ranges and cooktops are the main culprits: NFPA's dedicated cooking report found they were involved in 53% of home cooking fires, 88% of cooking fire deaths and 74% of cooking fire injuries in 2017 to 2021. Ovens, microwaves, toasters and outdoor grills make up most of the rest.
The leading factor by far is unattended cooking. A cook steps away to answer the door, check a phone or put a child to bed, and a pan of oil can overheat and ignite surprisingly quickly. Frying is especially risky because cooking oil can burst into flame once it gets hot enough.
Key Risk Factors
- Leaving the stove while frying, grilling or broiling
- Cooking while drowsy or after drinking alcohol
- Loose sleeves, tea towels, oven gloves and packaging near burners
- Grease build-up on the hob, oven and extractor hood
- Throwing water on a grease fire, which can spread burning oil
Prevention
Stay in the kitchen whenever something is frying, grilling or boiling on the hob, and turn the heat off if you have to leave, even briefly. Keep a well-fitting lid within reach: if a pan catches fire, slide the lid over it and switch off the burner, then leave the lid in place until the pan cools. For a small oven fire, turn off the oven and keep the door closed. Never carry a burning pan outside, and never use water on oil.
If a cooking fire does not go out at once, or smoke is spreading, get everyone out, close the door behind you and call the emergency number from outside.
Interesting Facts
- NFPA's cooking report found that more than half of non-fatal cooking fire injuries happened when people tried to control the fire themselves.
- More than a quarter of the people killed by cooking fires were asleep when they were fatally injured.
- Thanksgiving averaged about 1,470 home cooking fires in 2017 to 2021, more than three times the daily average of 430.
- Households with electric ranges had a higher risk of cooking fires than those with gas ranges.
- In England, cooking appliances were the ignition source in 44% of accidental dwelling fires in the year ending March 2025, according to UK government statistics.
2. Heating Equipment
| Attribute | Details |
|---|---|
| Home fires per year | 64,958 (20%) |
| Deaths per year | 432 (17%), the second-highest of any cause |
| Injuries per year | 1,527 (14%) |
| Main danger | Space heaters placed too close to things that can burn |
| Peak season | December to February |
How It Starts
Heating fires follow the seasons. They rise as soon as the weather turns cold and people switch on furnaces, light wood stoves and plug in portable heaters. The most common scenario is simple: a heater sits too close to bedding, curtains, clothing or furniture, and the radiant heat ignites it. Other heating fires start in chimneys lined with creosote, a tar-like residue from burning wood, or from a fireplace that throws sparks onto a rug.
Key Risk Factors
- Portable space heaters, the deadliest type of heating equipment
- Heaters left running in an empty room or while people sleep
- Chimneys and flues that have not been inspected or cleaned
- Hot ashes thrown into a bin or paper bag before they have cooled
- Using an oven or stove burner to heat a room
Prevention
NFPA's heating advice is to keep anything that can burn at least three feet (about one metre) away from heating equipment, including furnaces, fireplaces, wood stoves and portable heaters. It also recommends a three-foot "kid-free zone" around open fires and space heaters, switching portable heaters off before leaving a room or going to sleep, and having heating equipment and chimneys inspected and cleaned every year by a qualified professional.
Choose space heaters that switch off automatically if they tip over, plug them directly into a wall outlet rather than an extension cord, and put fireplace ashes in a metal container with a lid, stored outdoors away from the house.
Why Space Heaters Matter Most
NFPA's 2022 heating report found that space heaters caused about one-third of home heating fires in 2016 to 2020, but nearly nine in ten of the deaths. NFPA's later figures for 2020 to 2024 group space heaters and heating stoves together; according to NFPA's heating safety page, they caused nearly a third of heating fires (30%) but more than seven in ten of the deaths (73%).
Interesting Facts
- Heating was the second leading cause of home fires, home fire injuries and home fire deaths in NFPA's 2019 to 2023 figures.
- In 2016 to 2020, heating fires that started between midnight and 6 a.m. made up only 13% of heating fires but 43% of the deaths.
- Nearly half of home heating fires (46%) occurred in December, January and February, according to NFPA's 2020 to 2024 data.
- In England, chimney fires attended by fire services fell from 5,190 in the year ending March 2015 to 2,019 in the year ending March 2025.
3. Electrical Distribution, Lighting and Power Transfer
| Attribute | Details |
|---|---|
| Home fires per year | 31,647 (10%) |
| Deaths per year | 425 (16%) |
| Injuries per year | 1,279 (12%) |
| Direct damage per year | 1.58 billion US dollars (18%), the largest share of any cause |
| Includes | Wiring, outlets, switches, cords, plugs, power supplies and lighting |
How It Starts
Electrical fires usually begin with arcing: electricity jumping across a gap where insulation has worn, a connection has loosened or a wire has been damaged. The arc produces intense local heat that can ignite insulation, wood framing or dust. Overloaded circuits, damaged cords and lamps with bulbs above their rated wattage can also overheat. Because wiring runs through walls, floors and attics, these fires may smoulder out of sight before anyone notices smoke.
Key Risk Factors
- Old or damaged wiring, especially in older homes that have not been rewired
- Extension cords used as permanent wiring, or run under rugs and furniture
- Overloaded outlets and multi-plug adapters
- Outlets or switches that feel warm, buzz or spark
- Lights that flicker or circuit breakers that trip repeatedly
Prevention
Have a qualified electrician inspect the wiring in an older home, and whenever you notice warning signs such as scorch marks, a burning smell or frequent tripping. Plug major appliances directly into wall outlets, use extension cords only for temporary needs, and replace any cord that is cracked, frayed or pinched. Use bulbs that match the wattage printed on the fitting. In many countries, arc-fault and residual-current devices can be added to a consumer unit or panel to cut power when dangerous faults occur.
Interesting Facts
- Extension cords were involved in only about 1,589 home fires a year but 79 deaths, a high toll for so few fires.
- NFPA's 2026 report on home electrical fires, which uses a broader definition, found that fires between midnight and 8 a.m. made up 22% of electrical fires but 52% of the deaths in 2020 to 2024.
- The same report found that electrical fires most often started in a kitchen (15%), bedroom (12%) or attic or ceiling space (9%).
- Electrical distribution and lighting was the leading cause of fires that started in bedrooms, according to NFPA's Home Structure Fires report.
4. Intentional Fires (Arson)
| Attribute | Details |
|---|---|
| Home fires per year | 24,601 (7%) |
| Deaths per year | 119 (5%) |
| Injuries per year | 463 (4%) |
| Definition | Fires caused by deliberate misuse of a heat source or of an incendiary nature |
| Common first fuel | Rubbish, trash or waste |
How It Starts
Intentional fires are set on purpose. NFPA points out that its "intentional" category overlaps with, but is not the same as, the legal crime of arson. It includes, for example, fires set deliberately by children too young to be held legally responsible. Many intentional fires start outside the house, in bins, rubbish piles, porches or vacant structures, and then spread to the building.
Key Risk Factors
- Rubbish, recycling and bulky waste stored against the house
- Unlocked sheds, garages and outbuildings
- Vacant or boarded-up properties nearby
- Poor outdoor lighting around entrances and bins
- Household disputes and other conflicts that may escalate
Prevention
Store wheelie bins and recycling away from walls, doors and windows, ideally in a locked or enclosed area, and put them out only on collection day. Keep garages and sheds locked, fit motion-sensor lighting at entrances, and report vacant buildings, fly-tipping or suspicious behaviour to local authorities. If someone threatens to set a fire, contact the police.
Interesting Facts
- NFPA's Intentional Structure Fires report found that more than half of intentional structure fires were ignited by a lighter or match.
- Over one-third of intentional structure fires began in an outdoor area, such as a lawn, field or unclassified outside area.
- Intentional fires peaked in the late afternoon and early evening, from 4 p.m. to 9 p.m.
- In England, fire services recorded 2,457 deliberate dwelling fires in the year ending March 2025.
5. Lighters, Matches and Other Small Open Flames
| Attribute | Details |
|---|---|
| Home fires per year | 24,336 (7%), including candle fires |
| Deaths per year | 287 (11%) |
| Injuries per year | 1,436 (13%) |
| Key danger | Children playing with lighters and matches |
| Leading room for fire play | Bedroom (34% of home fire-play fires, 2014 to 2018) |
How It Starts
This NFPA group covers fires started by small open flames: cigarette lighters, matches, candles and flames or torches used for lighting. Candles are profiled separately at number 10. NFPA's heat-source table shows that cigarette lighters alone started about 8,257 home fires a year in 2019 to 2023 and matches about 3,982.
A large share of these fires involve children. Young children are naturally curious about fire, and a lighter left on a table or in a coat pocket is easy to pick up. Fire play often happens in a bedroom or another space where a child is alone. NFPA found that almost one in five home fire-play fires (18%) began with a mattress or bedding.
Key Risk Factors
- Lighters and matches left within reach of young children
- Children left unsupervised, even for short periods
- Novelty lighters that look like toys
- Using a lighter or match near bedding, paper or curtains
- Older children experimenting with fire out of curiosity
Prevention
Store lighters and matches high up, ideally in a locked cabinet, and never treat them as toys. Teach children that fire is a tool for adults and that they should tell a grown-up if they find a lighter or matches. If a child shows repeated interest in setting fires, many fire departments run youth fire-setter intervention programmes that can help.
Interesting Facts
- NFPA's Playing with Fire report estimated 4,960 home fires a year caused by fire play in 2014 to 2018, causing about 50 deaths and 400 injuries.
- Lighters were involved in 55% of those home fire-play fires; matches were involved in 14% but in 33% of the deaths.
- Home fires caused by playing with fire fell by 80% between 1990 and 2018, from nearly 22,000 to about 4,400.
- NFPA credits the US safety standard requiring disposable lighters to be child-resistant, in effect since 1994, with helping to cut deaths, injuries and damage.
6. Smoking Materials
| Attribute | Details |
|---|---|
| Home fires per year | 15,209 (5%) |
| Deaths per year | 590 (23%), the leading cause of home fire deaths |
| Injuries per year | 1,048 (10%) |
| Includes | Cigarettes, pipes, cigars and undetermined smoking materials |
| Deadliest rooms | Living room and bedroom |
How It Starts
A cigarette does not need to be dropped carelessly to start a fire; it only needs to be left smouldering against something that can burn. The deadliest scenario is a smoker who falls asleep on a sofa or in bed. A cigarette can smoulder in upholstery or bedding for some time before flames appear, by which time the room is filling with toxic smoke. Other smoking fires begin outdoors, when butts are stubbed out in plant pots or dropped on porches and balconies.
Key Risk Factors
- Smoking in bed, or on a sofa when tired
- Smoking after drinking alcohol or taking medication that causes drowsiness
- Emptying ashtrays into bins before the contents are cold
- Using plant pots, which may contain flammable peat or bark, as ashtrays
- Smoking anywhere medical oxygen is used
Prevention
The safest option is to smoke outside, using a deep, sturdy ashtray on a stable surface. Make sure cigarettes are fully put out, ideally by soaking butts in water or sand, before throwing them away. Never smoke in bed, and avoid smoking in a chair or sofa if you feel drowsy. Never smoke where medical oxygen is in use, because oxygen makes materials burn much faster.
Interesting Facts
- The most common starting point for smoking-material fires was an exterior balcony or porch, but fires starting in living rooms and bedrooms caused about 69% of the deaths.
- Upholstered furniture was the first item ignited in about 888 smoking fires a year, which caused about 156 deaths.
- Of those fatally injured in smoking fires, 88% were at least 45 years old.
- In England, smoking materials started 6.7% of accidental dwelling fires in the year ending March 2025 but accounted for 25% of the deaths in them, the largest share of any ignition source.
7. Clothes Dryers and Washing Machines
| Attribute | Details |
|---|---|
| Home fires per year | 10,263 (3%) |
| Deaths per year | 19 (1%) |
| Injuries per year | 222 (2%) |
| Main danger | Lint build-up in the dryer and its vent |
| Leading factor | Failure to clean |
How It Starts
Tumble dryers work by blowing hot air through damp clothes. As the drum turns, fabric sheds lint, a fluffy mass of fibres that is highly flammable. Much of it is trapped in the filter, but some is carried into the dryer housing and the exhaust vent. When lint builds up, airflow drops, the machine runs hotter, and a spark or hot surface can set the lint alight. Blocked vents, crushed ducts and bird nests in outside vents make the problem worse.
Key Risk Factors
- Not cleaning the lint filter after every load
- Vents and ducts that are never checked or cleared
- Long, kinked or crushed plastic or foil ducts
- Drying items soiled with cooking oil, petrol or solvents
- Running the dryer overnight or while nobody is home
Prevention
Clean the lint filter before or after each load, and have the vent and ductwork cleaned regularly. Check that the outside vent flap opens when the dryer is running and is not blocked by snow, leaves or nests. Do not overload the drum, and avoid drying clothes stained with oil or flammable liquids unless they have been thoroughly washed. Follow the manufacturer's instructions, and register appliances so you hear about recalls.
Interesting Facts
- NFPA found that most home fires involving washers or dryers (92%) involved clothes dryers, in its 2017 report covering 2010 to 2014.
- In that report, failure to clean was the leading cause (31%) of these fires.
- The US Fire Administration found that dust, fibre and lint (28%) and clothing (27%) were the leading items first ignited in residential dryer fires.
- According to the US Fire Administration, residential dryer fires peaked in January.
8. Fans and Air Conditioners
| Attribute | Details |
|---|---|
| Home fires per year | 7,382 (2%) |
| Deaths per year | 27 (1%) |
| Injuries per year | 238 (2%) |
| Breakdown | Fans about 4,928 fires; air conditioners about 2,454 fires |
| Main danger | Worn motors, damaged cords and continuous use |
How It Starts
Fans and air conditioners rarely come to mind as fire hazards, yet they run for long hours, often unattended and often overnight. An electric motor that is clogged with dust, has worn bearings or has a failing capacitor can overheat. Cheap or damaged power cords, window units plugged into undersized extension leads and portable fans left running beside bedding or curtains all add to the risk.
Key Risk Factors
- Old or damaged fans that hum, rattle or smell hot
- Running window air conditioners on light-duty extension cords
- Dust and lint clogging motor vents
- Fans left running on soft furnishings or close to curtains
- Ignoring recalls on fans, dehumidifiers and portable cooling units
Prevention
Plug air conditioners directly into a suitable wall outlet, keep fan vents and grilles free of dust, and stop using any unit that makes unusual noises, smells of burning or has a damaged cord. Place fans on a hard, stable surface away from fabrics. Switch fans off when you leave the house, and check whether your model has been recalled.
Interesting Facts
- NFPA lists fans and air conditioners among its ten leading causes of home fires, alongside better-known hazards such as candles.
- In bedrooms, fans or air conditioners started about 5% of fires, according to NFPA's room-by-room analysis.
- The average fan and air-conditioner fire caused about 35,400 US dollars in damage, roughly five times the average cooking fire, by calculation from NFPA's figures.
9. Exposure to Another Fire
| Attribute | Details |
|---|---|
| Home fires per year | 6,510 (2%) |
| Deaths per year | 27 (1%) |
| Injuries per year | 52 |
| Direct damage per year | 409 million US dollars (5%) |
| Notable feature | The highest average loss per fire of all the major causes |
How It Starts
An exposure fire is one that starts outside the home and spreads to it. The source might be a neighbouring house or apartment, a burning car, a garden or brush fire, or a wildfire. Heat moves by direct flame contact, radiant heat strong enough to ignite siding or window frames, or wind-blown embers that land in gutters, vents and decks.
Key Risk Factors
- Homes built close together with combustible siding or fences
- Dry vegetation, wood piles and debris next to walls
- Leaves and pine needles collected in gutters and on roofs
- Open vents and gaps where embers can enter
- Living in or near wildfire-prone areas
Prevention
Clear dead leaves, needles and dry plants from roofs, gutters and the area immediately around the house. Store firewood, gas cylinders and other fuel away from walls. In wildfire-prone regions, follow local guidance on fire-resistant materials, ember-resistant vents and defensible space. When authorities order an evacuation, leave promptly.
Interesting Facts
- NFPA found that fires caused by exposure to another fire had the highest average property loss per fire of all the major causes.
- By calculation from NFPA's figures, the average exposure fire caused about 62,800 US dollars in direct damage, against about 7,200 for a cooking fire.
- Exposure fires caused about 5% of all home fire property damage, while making up only 2% of home fires.
10. Candles
| Attribute | Details |
|---|---|
| Home fires per year | 5,830 (2%) |
| Deaths per year | 66 (3%) |
| Injuries per year | 572 (5%) |
| Peak month | December, followed closely by January |
| Leading room | Bedroom (more than one-third of candle fires) |
How It Starts
A candle is an open flame, and it will ignite anything that comes close enough. NFPA's candle report found that three in five candle fires started when something that could burn, such as furniture, bedding, curtains or decorations, was too close to the flame. Others begin when candles are left burning in an empty room, knocked over by pets or children, or allowed to burn down until the container overheats.
Key Risk Factors
- Candles placed near curtains, bedding, paper or decorations
- Burning candles in bedrooms, where people may fall asleep
- Leaving candles alight in an empty room or overnight
- Using candles for light during power cuts
- Lightweight holders that tip over easily
Prevention
NFPA advises keeping candles at least one foot (30 cm) from anything that can burn, using sturdy holders on uncluttered surfaces, and blowing out every candle before leaving the room or going to sleep. It also recommends avoiding candles in bedrooms and other places where people may fall asleep, using torches or battery lights rather than candles during power outages, and never using candles where medical oxygen is in use. Flameless LED candles give a similar effect with no flame at all.
Interesting Facts
- In NFPA's 2014 to 2018 data, there were almost three times as many candle fires on Christmas Day as on an average day.
- Twelve percent of December candle fires began with decorations, compared with only 4% in the rest of the year.
- Unlike home fires overall, a majority of candle fire deaths (58%) and injuries (54%) were female.
- The share of US home fires started by candles rose from about 1% in the early 1980s to 5% in the early 2000s before falling back to 2%.
How the Top Causes Compare by Room
Each room of the home has its own typical fire. NFPA's room-by-room analysis for 2019 to 2023 shows where to focus prevention.
| Room | Share of home fires | Share of home fire deaths | Leading causes |
|---|---|---|---|
| Kitchen or cooking area | 41% | 16% | Cooking (89% of kitchen fires), then heating equipment |
| Bedroom | 6% | 24% | Electrical (30% of bedroom fires), then candles (12%); smoking materials cause 33% of bedroom fire deaths |
| Living room | 5% | 25% | Heating equipment (36% of living room fires), then electrical (17%); smoking materials cause 32% of deaths |
| Garage or vehicle storage | 3% | 2% | Varied causes, but 11% of all home fire property damage |
Source: NFPA, Home Structure Fires (August 2025) and Supporting Tables 7, 15, 16 and 17, annual averages for 2019 to 2023.
The kitchen produces the most fires, but living rooms and bedrooms together produce about half of the deaths. Roughly two-thirds of home fire deaths and injuries (65%) came from fires in just three rooms: living rooms, bedrooms and kitchens. Fires in garages, on porches and in attics caused a disproportionate amount of damage, because they are less likely to be spotted while still small.
Home Fire Prevention Checklist
Most of the causes above can be tackled with a few habits and a small amount of equipment. The checklist below groups the most effective steps.
| Area | What to do | Causes it addresses |
|---|---|---|
| Smoke alarms | Fit alarms inside and outside sleeping areas and on every level; test monthly; replace units every 10 years | All causes |
| Kitchen | Stay with cooking; keep a lid nearby; keep towels and packaging away from burners | Cooking |
| Heating | Keep a three-foot clear zone; switch heaters off at night; service chimneys yearly | Heating, exposure |
| Electrics | Replace damaged cords; avoid overloading; have old wiring checked | Electrical, fans and air conditioners |
| Open flames | Store lighters and matches out of reach; use flameless candles | Lighters and matches, candles |
| Smoking | Smoke outside; use deep ashtrays; soak butts before disposal | Smoking materials |
| Laundry | Clean the lint filter every load; clear the vent regularly | Clothes dryers |
| Outside | Keep bins, rubbish and dry vegetation away from walls; secure sheds | Arson, exposure |
| Escape plan | Know two ways out of every room; agree a meeting point outside; practise | All causes |
Smoke Alarms and Sprinklers
Detection is the safety net for every cause on this list. NFPA reports that almost three in five US home fire deaths in 2019 to 2023 occurred in fires where no smoke alarm was present (43%) or an alarm was present but did not work (14%). It recommends alarms in every bedroom, outside each sleeping area and on every level, ideally interconnected so that when one sounds they all sound. Alarms should be tested monthly and replaced 10 years after their manufacture date.
Home sprinklers add a second layer of protection. In NFPA's 2017 to 2021 data, the death rate per 1,000 reported home fires was 89% lower when sprinklers were present, yet sprinklers were found in only 7% of reported home fires. In England, government analysis estimates that people living in homes without a working smoke alarm were around 11 times more likely to die in a dwelling fire than those with one.
When to Call the Emergency Services
A fire can grow from a small flame to a room full of smoke in a few minutes. NFPA notes that you may have as little as two minutes to escape once an alarm sounds. Call the fire service whenever a fire is not out immediately, when smoke is spreading, when anyone is hurt or trapped, or when you are unsure.
- Get everyone out first, closing doors behind you to slow the spread of smoke and fire.
- Call from outside, using the local emergency number, such as 911 in the US, 999 in the UK or 112 across the EU.
- Never go back inside a burning building for belongings or pets.
- If your clothes catch fire, stop where you are, drop to the ground and roll to smother the flames.
- Even if you put a small fire out yourself, have the fire service check it, especially if it involved electrics or got into walls or ceilings.
Frequently Asked Questions
What is the most common cause of house fires?
Cooking. In NFPA's 2019 to 2023 figures, cooking caused about 159,400 US home fires a year, 49% of the total, and 36% of home fire injuries. Most cooking fires start on the range or cooktop, and unattended cooking is the leading factor. Staying in the kitchen while frying or grilling prevents many of them.
What causes the most deaths in house fires?
Smoking materials. Cigarettes, pipes and cigars started only 5% of US home fires in 2019 to 2023 but caused about 23% of home fire deaths, roughly 590 a year. The deadliest fires begin when a smoker falls asleep and a cigarette ignites a sofa or bedding. UK statistics for England show the same pattern.
What time of year do most house fires happen?
Home fires peak in the colder months. NFPA found that 46% of US home fires and 53% of home fire deaths in 2019 to 2023 occurred from November to March, when people spend more time indoors and use heaters, candles and decorations. By time of day, reported fires peak from 5 p.m. to 8 p.m.
Are electrical fires more dangerous than other house fires?
They tend to be more destructive. Electrical distribution and lighting fires caused about 13 deaths per 1,000 fires, versus under 3 for cooking, and the largest share of property damage, about 18%. Because they often start inside walls, ceilings or attics, they can spread unseen before anyone notices smoke or a burning smell.
How can I prevent a house fire?
Focus on the leading causes: never leave cooking unattended, keep heaters at least three feet from anything that can burn, replace damaged cords, smoke outside, store lighters out of children's reach and clean the dryer lint filter every load. Above all, fit working smoke alarms on every level and test them monthly.
Should I try to put out a house fire myself?
Only if it is very small, contained and you have a clear way out, such as a pan fire you can smother with a lid. NFPA found that more than half of non-fatal cooking fire injuries happened when people tried to fight the fire. If in doubt, get out, close the door and call emergency services.
Conclusion
The ten most common causes of house fires are cooking, heating equipment, electrical faults, intentional fire-setting, lighters and matches, smoking materials, clothes dryers, fans and air conditioners, fires spreading from nearby, and candles. Cooking starts the most fires by a wide margin, but smoking materials kill the most people, and electrical fires cause the most damage.
The encouraging lesson from the data is how preventable most of these fires are. Nearly every cause on the list traces back to a familiar moment: a pan left alone, a heater too close to a bed, a lighter in reach of a child, a cigarette not fully out. Simple habits break those chains, and working smoke alarms, an escape plan and a quick call to emergency services give everyone in the home the time they need if a fire starts anyway.
- National Fire Protection Association (NFPA), Home Structure Fires, by Shelby Hall and Tucker McGree, August 2025, and Home Structure Fires Supporting Tables (Tables 5, 6, 8, 9 and 10, estimated annual averages 2019 to 2023). https://www.nfpa.org/education-and-research/research/nfpa-research/fire-statistical-reports/home-structure-fires
- NFPA, Home Cooking Fires, by Shelby Hall and Tucker McGree, September 2023 (data for 2017 to 2021). https://content.nfpa.org/-/media/Project/Storefront/Catalog/Files/Research/NFPA-Research/US-Fire-Problem/Fire-causes/oscooking.pdf
- NFPA, Home Heating Fires, by Richard Campbell, December 2022 (data for 2016 to 2020), and NFPA Home Heating Safety page (data for 2020 to 2024), accessed October 2026. https://content.nfpa.org/-/media/Project/Storefront/Catalog/Files/Research/NFPA-Research/US-Fire-Problem/Fire-causes/osHeating.pdf and https://www.nfpa.org/education-and-research/home-fire-safety/heating
- NFPA, Home Electrical Fires, by Tucker McGree, May 2026 (data for 2020 to 2024). https://content.nfpa.org/-/media/Project/Storefront/Catalog/Files/Research/NFPA-Research/Electrical/osHomeElectricalFires.pdf
- NFPA, Home Fires Started by Smoking Materials, by Tucker McGree, March 2025 (data for 2019 to 2023). https://content.nfpa.org/-/media/Project/Storefront/Catalog/Files/Research/NFPA-Research/US-Fire-Problem/Fire-causes/ossmoking.pdf
- NFPA, Home Candle Fires, by Marty Ahrens, May 2020 (data for 2014 to 2018), and NFPA candle safety tip sheet. https://content.nfpa.org/-/media/Project/Storefront/Catalog/Files/Research/NFPA-Research/US-Fire-Problem/Fire-causes/osCandles.pdf
- NFPA, Playing with Fire: Structure Fires, by Richard Campbell, May 2021 (data for 2014 to 2018). https://content.nfpa.org/-/media/Project/Storefront/Catalog/Files/Research/NFPA-Research/US-Fire-Problem/Fire-causes/osPlayingWithFireStructures.pdf
- NFPA, Intentional Structure Fires, by Richard Campbell, September 2021 (data for 2014 to 2018). https://content.nfpa.org/-/media/Project/Storefront/Catalog/Files/Research/NFPA-Research/US-Fire-Problem/Fire-causes/osintentional.pdf
- NFPA, Home Fires Involving Clothes Dryers and Washing Machines, by Richard Campbell, March 2017 (data for 2010 to 2014). https://content.nfpa.org/-/media/Project/Storefront/Catalog/Files/Research/NFPA-Research/US-Fire-Problem/Fire-causes/oswashersdryers.pdf
- NFPA, Smoke Alarm Information, accessed October 2026. https://www.nfpa.org/education-and-research/home-fire-safety/smoke-alarms
- US Fire Administration, Clothes Dryer Fires in Residential Buildings (2008 to 2010), Topical Fire Report Series, Volume 13, Issue 7, August 2012. https://www.usfa.fema.gov/downloads/pdf/statistics/v13i7.pdf
- US Fire Administration, Residential building fire causes (2014 to 2023), NFIRS national estimates, page last reviewed 14 February 2025. https://www.usfa.fema.gov/statistics/residential-fires/causes.html
- UK Ministry of Housing, Communities and Local Government, Detailed analysis of fires and response times to fires attended by fire and rescue services, England, April 2024 to March 2025, published 14 August 2025. https://www.gov.uk/government/statistics/detailed-analysis-of-fires-england-april-2024-to-march-2025/detailed-analysis-of-fires-and-response-times-to-fires-attended-by-fire-and-rescue-services-england-april-2024-to-march-2025













Log in with