










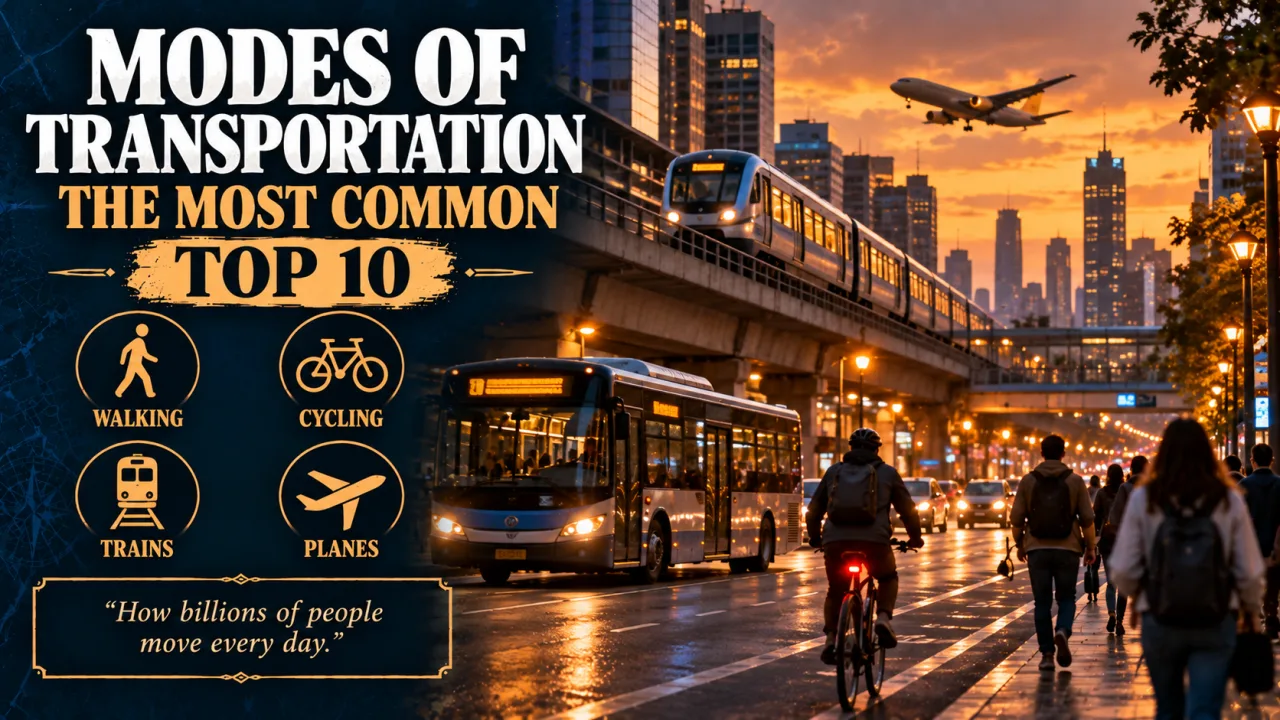
The most common modes of transportation are ten everyday ways people move, from walking and cycling to buses, trains and planes, used by billions worldwide.
Every day, several billion people leave home to reach a job, a classroom, a market or a relative's house. How they make that trip depends on where they live, how much money they have, how far they need to go and what infrastructure exists around them. A commuter in Tokyo, a farmer in rural Kenya, a student in Amsterdam and a delivery worker in Jakarta may all make similar journeys in completely different ways.
This guide, current as of October 2026, looks at the ten modes that carry the largest share of humanity from place to place. For each one it explains what the mode is, where it came from, how widely it is used today, what it does well, what it does badly and which numbers matter. Figures come from bodies such as the World Health Organization (WHO), the International Energy Agency (IEA), the International Air Transport Association (IATA), the International Association of Public Transport (UITP) and the ferry industry association Interferry, and every statistic was checked against at least two sources.
How We Chose These Modes
There is no single global census of every trip people make, so no list like this can be perfectly precise. Instead, each candidate was weighed against four practical tests.
- Reach: how many people use the mode regularly, measured by passengers, vehicles in service or share of trips where reliable data exists.
- Everyday role: whether people depend on it for routine travel such as commuting, school and shopping, not just holidays.
- Geographic spread: whether it is common across many regions, rather than in one country.
- Distinctiveness: each entry must be a genuinely different way of moving, with its own vehicles, infrastructure and trade-offs.
The order runs from the most universal, personal modes toward the more specialised ones that people use less often per head. Walking comes first because almost every journey, even a flight, starts and ends on foot. Air travel and ferries sit near the end not because they are small, since each carries billions of passengers a year, but because the average person boards them far less often than a bus or a car. Trams, e-scooters and animal-drawn carts appear in an Honorable Mentions section further down.
At a Glance
| No. | Mode | Typical use | Origin of the modern form | Key figure |
|---|---|---|---|---|
| 1 | Walking | Short trips, first and last mile | As old as humanity | About 5 km/h average pace |
| 2 | Car | Door-to-door personal travel | Benz patent, 1886 | More than 1.6 billion cars in use |
| 3 | Bus and coach | Shared road travel in and between cities | Paris coaches, 1662 | Coach about 27 g CO2e per passenger-km |
| 4 | Motorcycle and scooter | Fast, cheap personal trips, deliveries | Daimler Reitwagen, 1885 | Riders 21% of road deaths |
| 5 | Bicycle | Short and medium urban trips | Drais running machine, 1817 | More than 1 billion bicycles |
| 6 | Passenger train | Commuter and intercity travel | Stockton and Darlington, 1825 | India alone: 6.9 billion trips a year |
| 7 | Metro and subway | High-volume city travel | London, 10 January 1863 | 202 metro cities by end of 2023 |
| 8 | Taxi, auto rickshaw and ride-hailing | On-demand hired rides | Taximeter, 1891 | First metered motor taxi, 1897 |
| 9 | Air travel | Long-distance and international trips | Wright Flyer, 1903 | 4.8 billion passengers in 2024 |
| 10 | Ferry and passenger boat | Water crossings, island links | Ancient river crossings | 4.27 billion passengers in 2019 |
1. Walking
Walking is the oldest and most universal of all modes of transportation. It needs no fuel, no licence and no ticket, and nearly every other mode depends on it, because people walk to the bus stop, across the station and from the car park to the office door. In the WHO's global road-safety survey, nine in ten people described themselves as pedestrians.
Origins
Humans have travelled on foot since our species began, and for most of history walking was the only way most people ever moved. Footpaths, trade routes and pilgrimage trails crossed every inhabited continent long before wheels or saddles were common, and many modern roads still follow those early tracks.
As cities grew, walking shaped their form. Old town centres with narrow lanes and short distances between homes, markets and workplaces reflect a time when nearly everything had to be reachable on foot within an hour or so.
How It Is Used Today
Walking remains the main way of getting around for hundreds of millions of people in low-income countries and in dense old cities, and it is part of almost every trip elsewhere. Researchers who study pedestrian crossings put typical adult walking speed at about 5 kilometres per hour, or roughly 1.4 metres per second, with older people a little slower and younger adults a little faster. That pace makes walking ideal for trips of up to two or three kilometres.
Urban planners increasingly treat walkability as a measure of a healthy city. Wide pavements, safe crossings, shade and mixed land use make people more likely to choose their feet over a short drive.
Pros and Cons
- Advantages: free, zero direct emissions, available to almost everyone, and a valuable source of daily physical activity that helps adults reach the WHO recommendation of at least 150 minutes of moderate activity a week.
- Drawbacks: slow over longer distances, tiring with heavy loads, and exposed to weather.
- Safety: pedestrians are among the most vulnerable road users. The WHO estimates that pedestrian deaths rose about 3% to 274,000 between 2010 and 2021, around 23% of all road deaths, and that 80% of the world's roads fail to meet pedestrian safety standards.
Key Figures
- Average walking pace: about 5 km/h (1.4 m/s)
- Share of global road deaths: 23% (WHO, 2021 data)
- Pedestrian deaths in 2021: about 274,000
- Roads meeting pedestrian safety standards: only about one in five
- People identifying as pedestrians: about 9 in 10 (WHO survey)
2. Car
The private car is the defining vehicle of modern personal travel. It offers door-to-door journeys on demand, carries passengers and luggage in comfort, and has shaped how suburbs, shopping centres and highways are laid out in much of the world. Estimates compiled from industry data put the global stock at more than 1.6 billion cars in use as of 2025.
Origins
Many inventors built self-propelled road vehicles in the 19th century, but the modern car is usually dated to 29 January 1886, when the German engineer Carl Benz applied for a patent on his three-wheeled Patent-Motorwagen. The patent, number 37435, was granted on 2 November that year. In August 1888 his wife, Bertha Benz, drove one of the vehicles about 106 kilometres from Mannheim to Pforzheim, a trip often described as the first long-distance car journey and a powerful early advertisement.
Mass ownership came from the United States. The Ford Model T went on sale in 1908, and the introduction of the moving assembly line in 1913 cut production time and costs dramatically. Its price fell from 780 dollars in 1910, and by May 1927 the 15 millionth Model T had been built.
How It Is Used Today
Cars dominate travel in North America, Australia and much of Europe and the Middle East, and ownership is rising fast across Asia, Latin America and Africa. They are used for commuting, school runs, shopping, holidays and, increasingly, shared and hired trips.
The biggest change of the 2020s is electrification. According to the IEA's Global EV Outlook 2025, more than 17 million electric cars were sold worldwide in 2024, over 20% of all new cars. China accounted for more than 11 million of them, nearly half of its domestic car sales, and the IEA expected global sales to pass 20 million in 2025, or more than one in four new cars.
Pros and Cons
- Advantages: flexible timing and routes, private space, ability to carry several people and goods, and access to places that public transport does not reach.
- Drawbacks: high purchase and running costs, congestion, parking demand and a large footprint per traveller. UK government conversion factors put an average petrol car at about 170 grams of CO2 equivalent per passenger-kilometre when driven alone, compared with about 47 grams for an average electric car.
- Safety: occupants of cars and other four-wheeled light vehicles make up about 30% of global road deaths, according to the WHO. Wearing a seat-belt reduces the risk of death among vehicle occupants by up to 50%.
Key Figures
- Patent application: 29 January 1886 (Benz, DRP 37435)
- Model T production run: more than 15 million by 1927
- Cars in use worldwide: more than 1.6 billion (2025 estimate)
- Electric car sales in 2024: more than 17 million, over 20% of new sales
- Petrol car, single occupant: about 170 g CO2e per passenger-km
For a look at the very top of the car market, see Finepedia's guide to the most expensive cars in the world.
3. Bus and Coach
The bus is the workhorse of public transport. In cities it runs on fixed routes with frequent stops; between cities, coaches carry passengers hundreds of kilometres for a fraction of the price of a train or plane. Because a bus needs only a road, it can serve places where rail would be far too expensive to build.
Origins
The idea of a shared, scheduled vehicle open to anyone who paid a fare is usually credited to the French mathematician and philosopher Blaise Pascal. His carrosses à cinq sols, or five-sol coaches, began running on fixed routes in Paris in 1662 and are often called the first modern public transport service.
The word omnibus, Latin for "for all", came from Nantes in the 1820s, where the businessman Stanislas Baudry ran a horse-drawn service that proved more popular as transport than as a way to bring customers to his bathhouse. He launched a Paris omnibus service in April 1828. Steam buses followed in the 1830s, electric trolleybuses in 1882, and the first motor buses ran in Germany's Siegerland region in 1895, using a six-seat vehicle derived from a Benz car.
How It Is Used Today
Buses are used in almost every country, from double-deckers in London and Hong Kong to minibuses and shared vans that form the backbone of informal transit in much of Africa, South Asia and Latin America. Long-distance coaches link cities across Europe, India, South America and North America.
Two trends stand out. Bus rapid transit (BRT), pioneered in the Brazilian city of Curitiba in the 1970s, gives buses dedicated lanes and station-style stops so they behave more like a metro at much lower cost. And electric buses are spreading quickly, especially in Chinese cities, cutting street-level noise and exhaust.
Pros and Cons
- Advantages: low fares, flexible routes, cheap to start compared with rail, and an efficient use of road space when full.
- Drawbacks: buses get stuck in the same traffic as cars unless they have their own lanes, and journeys can be slow because of frequent stops.
- Emissions: UK conversion factors put an average local bus at about 97 grams of CO2 equivalent per passenger-kilometre, well below a solo car, while a long-distance coach, which usually runs fuller, comes in at about 27 grams.
Key Figures
- First scheduled public coaches: Paris, 1662
- Paris omnibus launched: April 1828
- First motor bus service: Siegerland, Germany, 1895
- Average bus: about 97 g CO2e per passenger-km
- Coach: about 27 g CO2e per passenger-km
4. Motorcycle and Scooter
Two-wheelers, from small mopeds and scooters to large touring motorcycles, are the fastest-growing personal vehicles in many developing countries. They cost far less than a car, use less fuel, weave through congested traffic and park almost anywhere, which makes them the family vehicle of choice across much of South and Southeast Asia, parts of Africa and Latin America.
Origins
Steam-powered two-wheelers appeared in France and the United States in the late 1860s, but most historians treat the 1885 Daimler Reitwagen, built by Gottlieb Daimler and Wilhelm Maybach at Bad Cannstatt in Germany, as the first petrol-engined motorcycle. In 1894 the Munich firm Hildebrand and Wolfmüller began series production of the first machine sold as a Motorrad, the German word for motorcycle.
The scooter, with its step-through frame and enclosed engine, became a symbol of affordable mobility in post-war Italy and spread worldwide from there. Today electric scooters and motorcycles are a fast-growing segment, particularly in China, India and Southeast Asia.
How It Is Used Today
In cities such as Hanoi, Jakarta, Taipei and Delhi, two-wheelers often outnumber cars on the road. They carry commuters, families, groceries and an enormous share of food and parcel deliveries. In many countries they also work as motorcycle taxis, a role covered further under the taxi entry below.
Pros and Cons
- Advantages: low purchase price, low fuel use, agility in traffic and easy parking.
- Drawbacks: little protection from weather, limited luggage space and, for petrol models, local air and noise pollution. A UK average motorbike emits about 114 grams of CO2 equivalent per passenger-kilometre.
- Safety: riders of powered two- and three-wheelers account for about 21% of global road deaths, according to the WHO. Correct helmet use cuts the risk of death in a crash by more than six times and the risk of brain injury by up to 74%.
Key Figures
- First petrol motorcycle: Daimler Reitwagen, 1885
- First series production motorcycle: Hildebrand and Wolfmüller, 1894
- Share of global road deaths: about 21% (two- and three-wheelers)
- Helmet effect: risk of death reduced more than six-fold
- Average motorbike: about 114 g CO2e per passenger-km
5. Bicycle
The bicycle is one of the most efficient machines ever invented for moving a human body. It multiplies the distance a person can cover with the same effort, needs no fuel beyond food, and can be repaired with simple tools. By the early 21st century there were more than a billion bicycles in the world, and more than 60% of new ones are made in China.
Origins
The story begins in 1817, when the German inventor Karl Drais demonstrated his Laufmaschine, or running machine, a two-wheeled wooden frame that the rider pushed along with the feet. He patented it in France in February 1818 as the vélocipède. Drais was partly motivated by the need for transport that did not rely on horses, after the failed harvests of the 1816 Year Without a Summer.
Pedals, the tall penny-farthing and several dead ends followed. The modern shape arrived in 1885, when John Kemp Starley released the Rover, a chain-driven safety bicycle with two wheels of similar size. Three years later the Scottish inventor John Boyd Dunlop developed a practical pneumatic tyre, and the bicycle boom of the 1890s took off. Many technologies later used in cars, including ball bearings, chain drives and pneumatic tyres, were first developed for bicycles.
How It Is Used Today
Cycling levels vary hugely. In the Netherlands, which has about 18 million bicycles, or around 1.3 for every person old enough to ride, and some 35,000 kilometres of cycle paths, the bike is a normal way to get to school, work and the shops. Denmark, parts of Germany and many Chinese and Japanese cities also have high cycling shares, while in other places cycling is mainly recreational.
The electric bicycle, or e-bike, has widened the appeal by flattening hills and extending range, usually to somewhere between 40 and 120 kilometres per charge. The United Nations marks World Bicycle Day every 3 June.
Pros and Cons
- Advantages: cheap to buy and run, quick in congested cities, healthy, and very low emissions. Our World in Data estimates the footprint of cycling at roughly 16 to 50 grams of CO2 equivalent per kilometre, depending mostly on the rider's diet, and suggests that swapping a car for a bike on short trips cuts travel emissions by about 75%.
- Drawbacks: limited range and load, exposure to weather and dependence on safe infrastructure.
- Safety: the WHO estimates cyclist deaths rose by nearly 20% to about 71,000 between 2010 and 2021, around 6% of all road deaths, and only about 0.2% of the world's roads have cycle lanes.
Key Figures
- First running machine: Karl Drais, 1817
- First commercially successful safety bicycle: Rover, 1885
- Bicycles worldwide: more than 1 billion
- Netherlands: about 18 million bicycles and 35,000 km of cycle paths
- Cyclist share of road deaths: about 6%
6. Passenger Train
Railways move huge numbers of people quickly and efficiently over fixed tracks. Commuter lines bring workers into big cities, intercity and high-speed services link regions, and in countries such as India and China the train is the everyday long-distance choice for hundreds of millions of people.
Origins
Wagonways with horse-drawn carts ran on wooden or iron rails for centuries, but the railway age started in north-east England. The Stockton and Darlington Railway opened on 27 September 1825 as the first public railway to use steam locomotives, though horses still pulled some of its traffic. In 1829 George and Robert Stephenson's locomotive Rocket won the Rainhill Trials, and on 15 September 1830 the Liverpool and Manchester Railway opened as the first inter-city line worked entirely by steam, with a timetable and signalling.
The next leap came in Japan. The Tōkaidō Shinkansen between Tokyo and Osaka opened on 1 October 1964, just before the Tokyo Olympics, with trains running at up to 210 kilometres per hour. It launched the era of high-speed rail.
How It Is Used Today
India's railway network shows the scale rail can reach. In 2023–24 it ran an average of 13,198 passenger trains a day, served 7,325 stations and carried about 6.9 billion passengers. China, meanwhile, has built the world's largest high-speed network, now more than 50,000 kilometres long and about two-thirds of the global total, with lines designed for 200 to 380 kilometres per hour.
Europe, Japan and South Korea also rely heavily on rail for both commuting and intercity travel, and night trains have returned on several European routes in the 2020s as travellers look for alternatives to short flights. Rail tunnels are a big part of that story; Finepedia's list of the longest rail tunnels in the world shows how far engineers have gone to keep lines straight and fast.
Pros and Cons
- Advantages: high capacity, city-centre to city-centre service, reliability and a very low carbon footprint. UK national rail averages about 35 grams of CO2 equivalent per passenger-kilometre, and Our World in Data estimates that choosing the train instead of a car on medium-length trips cuts emissions by about 80%, and instead of a domestic flight by about 86%.
- Drawbacks: very expensive to build, fixed routes, and service quality that depends heavily on investment and maintenance.
- Safety: per passenger-kilometre, rail is far safer than road travel in most countries, though overcrowding and level crossings remain risks in some regions.
Key Figures
- First public steam railway: Stockton and Darlington, 27 September 1825
- First inter-city steam railway: Liverpool and Manchester, 15 September 1830
- First high-speed line: Tōkaidō Shinkansen, 1 October 1964
- Indian Railways, 2023–24: about 6.9 billion passengers
- National rail (UK): about 35 g CO2e per passenger-km
7. Metro and Subway
A metro, also called a subway, underground or rapid transit system, is an electric railway that runs on its own separated track, usually underground or elevated, with frequent trains designed for heavy urban traffic. In the world's largest cities it is the fastest way to cross town at rush hour.
Origins
The first was London's Metropolitan Railway, which opened to the public on 10 January 1863. Its first stretch ran about 6 kilometres (3.75 miles) between Paddington and Farringdon, with gas-lit wooden carriages hauled by steam locomotives through shallow cut-and-cover tunnels. Electric traction later made deep tunnels practical, and cities such as Budapest, Paris, Boston and New York had built their own systems by the early 20th century.
How It Is Used Today
The UITP's Global Metro Figures report counted 202 urban areas with at least one metro line as of 31 December 2023, with a combined 20,453 kilometres of route and a record 831 lines, giving about 1.12 billion people access to a metro. Asia-Pacific accounted for 63% of the world's metro length and 58% of its ridership, and China alone for 29% of global ridership. Ridership in 2023 had finally recovered to 2019 levels after the pandemic.
Greater Tokyo has the world's busiest metro network by annual ridership, followed by Moscow and Shanghai, while Shanghai has the longest, at around 800 kilometres. Many of these systems serve the megacities in Finepedia's guide to the busiest cities in the world.
Pros and Cons
- Advantages: very high capacity, immunity to road congestion, reliable journey times and low emissions per passenger. The London Underground averages about 28 grams of CO2 equivalent per passenger-kilometre.
- Drawbacks: enormous construction costs, long planning times and crowding at peak hours.
- Accessibility: older systems often lack lifts and step-free access, which many cities are now retrofitting.
Key Figures
- First metro: London, 10 January 1863
- Metro cities worldwide: 202 (end of 2023)
- Total metro length: 20,453 km on 831 lines
- Busiest network: Greater Tokyo
- London Underground: about 28 g CO2e per passenger-km
8. Taxi, Auto Rickshaw and Ride-Hailing
When people need a direct ride without owning a vehicle, they hire one. This entry groups several closely related services: licensed taxis, three-wheeled auto rickshaws, motorcycle taxis and app-based ride-hailing. Together they fill the gap between private and public transport, especially for airport runs, late-night trips and people who cannot or do not drive.
Origins
Carriages for hire were plying London's streets by the early 17th century, and Parliament legalised horse-drawn hackney carriages in 1635. The modern taxi took its name from the taximeter, a fare meter invented by the German Friedrich Wilhelm Gustav Bruhn in 1891. In 1897 Gottlieb Daimler built the Daimler Victoria, the world's first meter-equipped, petrol-powered taxicab.
The auto rickshaw, a motorised version of the cycle rickshaw, spread across Asia in the mid-20th century. Japan exported around 20,000 used three-wheelers to Southeast Asia, and Thailand developed its own designs after Japan abolished the three-wheeler licence in 1965. The vehicle became an icon of South Asian streets under many local names, including tuk-tuk.
How It Is Used Today
Yellow and black cabs, auto rickshaws in India and Pakistan, motorcycle taxis in Southeast Asia and East Africa, and smartphone ride-hailing services in most large cities now give urban residents several hired options. As of 2023, India had become the largest market for electric auto rickshaws, overtaking China.
Smartphone apps, which spread widely in the 2010s, changed the business by matching riders and drivers instantly, showing fares upfront and making it easy to share a car with strangers heading the same way. Many cities have responded with new licensing rules, and the debate over drivers' pay and status continues in several countries.
Pros and Cons
- Advantages: door-to-door convenience without the costs of ownership, availability around the clock in big cities, and a lifeline for people with limited mobility.
- Drawbacks: higher cost per trip than public transport, extra traffic from empty cruising between fares, and uneven regulation.
- Emissions: similar to a car per vehicle-kilometre, but better per person when rides are shared or vehicles are electric.
Key Figures
- Hackney carriages legalised in London: 1635
- Taximeter invented: 1891
- First metered petrol taxi: Daimler Victoria, 1897
- Used three-wheelers sent from Japan to Southeast Asia: about 20,000
- Largest electric auto rickshaw market (2023): India
9. Air Travel
Air travel shrank the planet. A journey that once took weeks by ship now takes hours, and airlines carry tourists, business travellers, migrants and students between almost every major city on Earth. It is the dominant mode for intercontinental passenger trips.
Origins
On 17 December 1903, at Kitty Hawk in North Carolina, Orville and Wilbur Wright made the first sustained, controlled flight of a powered heavier-than-air aircraft. The first hop lasted 12 seconds and covered 120 feet, or about 37 metres, which is less than the wingspan of a large modern airliner.
Commercial flying followed quickly. On 1 January 1914 the St. Petersburg–Tampa Airboat Line in Florida began the first scheduled airline service using winged aircraft. The jet age arrived in 1952, when the British de Havilland Comet became the first commercial jet airliner to enter service, and wide-body jets in the 1970s brought long-haul flights within reach of ordinary travellers.
How It Is Used Today
IATA reports that airlines carried a record 4.8 billion passengers on 40.6 million flights in 2024, and its mid-2026 figures estimate nearly 5 billion for 2025. In real terms, the association says, fares including extras were about 40% lower in 2024 than a decade earlier. Asia-Pacific, Europe and North America are the largest markets, and low-cost carriers have made flying common across India, Southeast Asia and Latin America.
Pros and Cons
- Advantages: unmatched speed over long distances, the ability to cross oceans and mountains, and an excellent safety record. In 2024 IATA counted seven fatal accidents among 40.6 million flights.
- Drawbacks: airports are usually far from city centres, security and check-in add hours, and costs rise quickly at peak times.
- Emissions: flying is the most carbon-intensive way to travel per kilometre on short routes. UK conversion factors, which include a multiplier for high-altitude warming effects, put domestic flights at about 246 grams of CO2 equivalent per passenger-kilometre and long-haul flights at about 148 grams. Researchers estimate aviation causes roughly 2.5% of global CO2 emissions but around 3.5% of human-caused warming.
Key Figures
- First powered, controlled flight: 17 December 1903
- First scheduled winged airline: 1 January 1914
- First jet airliner in service: de Havilland Comet, 1952
- Passengers in 2024: about 4.8 billion (IATA)
- Domestic flight: about 246 g CO2e per passenger-km
10. Ferry and Passenger Boat
Ferries are the quiet giants of transport. They carry commuters across harbours, connect islands to the mainland, take cars and lorries across straits, and serve river communities with no road or rail link at all. According to Interferry, ferries carry roughly as many passengers each year as airlines do.
Origins
Boats were among humanity's earliest vehicles, and ferrying people and animals across rivers is recorded in many ancient civilisations. Steam power in the 19th century turned river and harbour crossings into scheduled services, and some still run today. Hong Kong's Star Ferry, for example, was founded in 1888 as the Kowloon Ferry Company and took its current name in 1898; its boats still shuttle across Victoria Harbour between Hong Kong Island and Kowloon.
How It Is Used Today
A 2021 study for Interferry by Oxford Economics found that in 2019 ferries carried at least 4.27 billion passengers and 373 million vehicles worldwide, on a fleet of about 15,400 vessels, supporting around 1.1 million jobs. Asia accounts for most of that traffic, around 2.97 billion passengers, followed by Europe with roughly 794 million.
The busiest routes include the Dover to Calais crossing of the English Channel, which carried about 9.2 million passengers in 2018, and the short Øresund link between Helsingborg in Sweden and Helsingør in Denmark, the busiest route by departures. Helsinki was the world's busiest international passenger ferry port in 2017, with more than 11.8 million passengers. Larger ships built for leisure travel are a different market; Finepedia covers them in its guide to the most famous cruise ships in the world.
Pros and Cons
- Advantages: often the only practical link to islands and across wide rivers, high capacity for people and vehicles, and a low footprint for foot passengers, at about 19 grams of CO2 equivalent per passenger-kilometre in UK data.
- Drawbacks: slow compared with bridges or flights, sensitive to bad weather, and dependent on terminals at both ends.
- Safety: modern regulated ferries are generally safe, but overcrowded and poorly maintained vessels on some routes remain a serious concern, which is why safety rules and inspections matter so much.
Key Figures
- Ferry passengers worldwide in 2019: at least 4.27 billion
- Vehicles carried in 2019: about 373 million
- Global ferry fleet: about 15,400 vessels
- Asia's share: around 2.97 billion passengers
- Foot passenger on a ferry: about 19 g CO2e per passenger-km
Honorable Mentions
Several other modes carry large numbers of people but did not fit neatly into the top ten.
Trams and Light Rail
Street railways began with horse-drawn passenger service on the Swansea and Mumbles Railway in Wales in 1807, and the first public electric tramway for permanent service opened in Lichterfelde near Berlin in 1881. Many cities tore up their tracks in the mid-20th century, but modern trams and light rail have returned across Europe, Australia and North America. UK figures put trams at about 29 grams of CO2 equivalent per passenger-kilometre.
E-Scooters and Micromobility
Shared and privately owned electric kick scooters spread through cities from the late 2010s. They are handy for short hops but raise safety questions; the WHO's 2023 report estimated that users of such micromobility devices account for about 3% of global road deaths.
Animal-Powered Transport
Horses, donkeys, camels, oxen and elephants carried people and goods for thousands of years and remain important in parts of rural Africa, Asia and South America, where they cope with terrain and budgets that motor vehicles cannot.
How the Modes Compare
The table below compares typical greenhouse-gas emissions per passenger-kilometre using the UK Department for Energy Security and Net Zero's 2022 conversion factors, as charted by Our World in Data. Figures include non-CO2 gases and, for aviation, extra high-altitude effects. Real values vary with occupancy, vehicle age and each country's electricity mix.
| Mode | g CO2e per passenger-km | Best suited to | Main limitation |
|---|---|---|---|
| Walking | Close to zero | Trips up to about 2–3 km | Slow over distance |
| Bicycle | About 16–50 (food energy) | Urban trips up to about 10 km | Weather, safe lanes |
| Ferry (foot passenger) | About 19 | Harbour and island crossings | Weather, terminals |
| Coach | About 27 | Intercity road trips | Road congestion |
| London Underground (metro) | About 28 | Dense city travel | Very costly to build |
| Tram | About 29 | Medium-density city corridors | Shares streets with traffic |
| National rail | About 35 | Commuting, intercity | Fixed routes |
| Electric car | About 47 | Flexible personal travel | Purchase cost, charging |
| Average bus | About 97 | Local public transport | Stuck in traffic without bus lanes |
| Motorbike | About 114 | Agile personal trips | Rider safety |
| Long-haul flight | About 148 | Intercontinental travel | Climate impact |
| Petrol car (one person) | About 170 | Door-to-door trips | Congestion, emissions |
| Domestic flight | About 246 | Long domestic distances | Highest footprint per km |
Why It Matters
Transport produces around a quarter of the world's energy-related carbon dioxide emissions, and road crashes kill about 1.16 million people a year, according to the WHO's 2026 fact sheet. Choosing the right mode for each trip, and building cities that make walking, cycling and public transport easy, is one of the most effective ways to cut both numbers. Even one change helps: Our World in Data calculates that driving from Edinburgh to London, about 500 kilometres, emits roughly 85 kilograms of CO2 equivalent, compared with about 123 kilograms for the same trip by air.
Frequently Asked Questions
What is the most common mode of transportation in the world?
Walking is the most common mode of transportation, because almost every trip starts and ends on foot and hundreds of millions of people walk as their main way to get around. Among vehicles, cars, buses and two-wheelers carry the most people, with the balance varying sharply between rich and developing countries.
Which mode of transportation is the most environmentally friendly?
Walking and cycling have the lowest footprint, close to zero or roughly 16 to 50 grams of CO2 equivalent per kilometre for cycling. Among powered modes, trains, metros, trams, coaches and ferries for foot passengers usually emit between about 4 and 35 grams per passenger-kilometre, far below a petrol car driven alone.
What is the safest way to travel?
Per kilometre travelled, commercial aviation and rail are among the safest modes. IATA counted seven fatal airline accidents among 40.6 million flights in 2024. Road travel is far riskier: the WHO estimates about 1.16 million road deaths each year, with pedestrians, cyclists and motorcyclists making up more than half of them.
How many people fly each year?
IATA reports that airlines carried a record 4.8 billion passengers in 2024, on about 40.6 million flights. Its estimate for 2025 is close to 5 billion passengers. Many of these are repeat travellers, so the number of individual people who fly in a given year is much smaller than the passenger count.
Which city has the busiest metro system?
According to the UITP's Global Metro Figures, the Greater Tokyo Area had the world's busiest metro network by annual ridership in 2023, followed by Moscow and Shanghai. Shanghai has the longest network, at around 800 kilometres, and China as a whole accounts for about 29% of global metro ridership.
Are electric cars really cleaner than petrol cars?
Yes, in most countries. UK conversion factors put an average electric car at about 47 grams of CO2 equivalent per passenger-kilometre during driving, compared with about 170 grams for a petrol car. Building the battery adds emissions, but Our World in Data notes that an average driver typically pays this back in about two years.
Who invented the bicycle?
The German inventor Karl Drais built the first two-wheeled running machine in 1817, a pedal-less frame pushed along with the feet. The modern chain-driven safety bicycle arrived with John Kemp Starley's Rover in 1885, and John Boyd Dunlop's practical pneumatic tyre a few years later made cycling far more comfortable.
Conclusion
The most common modes of transportation reflect a simple trade-off between cost, speed, comfort and reach. Walking and cycling are cheap, healthy and clean but limited in range. Cars and motorcycles offer personal freedom at a high price in congestion, emissions and road deaths. Buses, trains, metros and ferries move enormous numbers of people efficiently when cities invest in them, and air travel connects the world at the highest carbon cost per kilometre.
As of October 2026, the clearest trends are electrification, from cars and buses to scooters and auto rickshaws, and a renewed focus on safe streets for people on foot and on bikes. Whichever mode you choose for your next trip, picking the right one for the distance is the simplest way to save money, time and emissions. For more road-trip inspiration, see Finepedia's guide to the most beautiful highways in the world.
- World Health Organization, Road traffic injuries fact sheet (2026): https://www.who.int/news-room/fact-sheets/detail/road-traffic-injuries
- World Health Organization, Despite notable progress, road safety remains urgent global issue (Global status report on road safety 2023): https://www.who.int/news/item/13-12-2023-despite-notable-progress-road-safety-remains-urgent-global-issue
- International Energy Agency, Global EV Outlook 2025, Executive summary: https://www.iea.org/reports/global-ev-outlook-2025/executive-summary
- IATA, Industry Statistics fact sheet: https://www.iata.org/en/iata-repository/pressroom/fact-sheets/industry-statistics/
- IATA, Annual Review 2025: https://www.iata.org/contentassets/c81222d96c9a4e0bb4ff6ced0126f0bb/iata-annual-review-2025.pdf
- UITP, Global Metro Figures 2024: https://www.uitp.org/publications/global-metro-figures-2024/
- Interferry, Ferry Industry Facts: https://interferry.com/ferry-industry-facts/
- Our World in Data, Which form of transport has the smallest carbon footprint?: https://ourworldindata.org/travel-carbon-footprint
- Wikipedia, Liverpool and Manchester Railway: https://en.wikipedia.org/wiki/Liverpool_and_Manchester_Railway
- Wikipedia, Dandy horse: https://en.wikipedia.org/wiki/Dandy_horse
- Wikipedia, Benz Patent-Motorwagen: https://en.wikipedia.org/wiki/Benz_Patent-Motorwagen
- Wikipedia, Metropolitan Railway: https://en.wikipedia.org/wiki/Metropolitan_Railway
- Wikipedia, Indian Railways: https://en.wikipedia.org/wiki/Indian_Railways
- Reference topic: 10MostToday, 10 Most Common Modes Of Transportation: https://10mosttoday.com/10-most-common-modes-of-transportation/
















Log in with